Coming off a tough 2022, we feel we are entering the “new normal” for SaaS valuation levels. While there’s been a lot of talk about how important profitability is in this new normal, we believe growth is still the most important metric. After all, we are using revenue multiples to value SaaS companies, not P/E multiples. This is because the best SaaS companies focus on acquiring customers and gaining share, executing against huge market opportunities – and then once at scale, they expect to be able to deliver meaningful profits to investors. We use revenue multiples as a proxy for a discounted cash flow analysis in SaaS because the majority of high-growth SaaS profits are 5+ years out.
Growth matters because higher top line often means more potential cash flows, but unit economics matter for the same reason: ultimately generating cash flows on the bottom line. This is why profitability is increasingly being discussed as the key second variable in the valuation equation. So let’s take a look at the levers of profitability and what a growing start-up should realistically assume, based on what we’ve seen over the past decade of investing in SaaS here at Sapphire Ventures.
Public Markets and Profitability
While “profitability” can mean different things to different investors, for SaaS companies, we tend to see focus on operating margin (EBIT). We believe operating margin paints a pretty good picture of a SaaS company’s ability to ultimately generate cash over the long term.
The first, and perhaps most important point to make, is that getting to profitability is difficult. Amongst the 56 comparable public companies that we use internally to benchmark our private companies, only 52% are expected to finish 2022 with positive EBIT margins. What stands out amongst this comp set? For one thing: size and growth. The median revenue of the EBIT positive companies is ~$1.3B, growing at ~28% YoY. In many ways, this is an obvious point. As companies scale, they gain more operating leverage across the entire business, enabling them to generate more profits.
The key to managing profitability, especially for a start-up, lies in how effectively and efficiently you can control the four key cost buckets listed below. (We plan to take a deeper look at some of these buckets in future blogs this year.)
- Cost of Goods Sold (COGS)
- Research & Development (R&D)
- Sales & Marketing (S&M)
- General & Administrative (G&A)
How do SaaS companies ultimately manage to profitability? Let’s take ServiceNow and Salesforce as examples of two mature software companies, still growing at scale (23% and 20% YoY growth for 2022, respectively). Both have gross margins of ~75%, which they were able to systematize as they scaled. Operating expenses as a % of revenue for both companies are in the 70-75% range, although how they get there looks slightly different. Both have G&A at around 10% of revenue, with strong consistency on this metric once they reached scale. At the margin, Salesforce spends more on S&M (~45% of revenue, which is a sticking point with Wall Street analysts by the way), while ServiceNow spends relatively more on R&D (~23% of revenue).
Both ServiceNow and Salesforce demonstrate what profitability at scale looks like: positive EBIT margins, driven by consistent growth, controlled G&A spend and investments in key business drivers (S&M for Salesforce, R&D for ServiceNow) – all leading to 20%+ cash flow margins.
Key Takeaways for Ambitious Start-Ups
The companies in our public comp set can serve as inspirations for the future, not benchmarks for where your SaaS company should be today. That being said, it’s never too early to start thinking about what your company might look like at scale. And with increased investor interest in managing to profitability more quickly, understanding bottom-line levers and the steady state of your business is more important than ever.
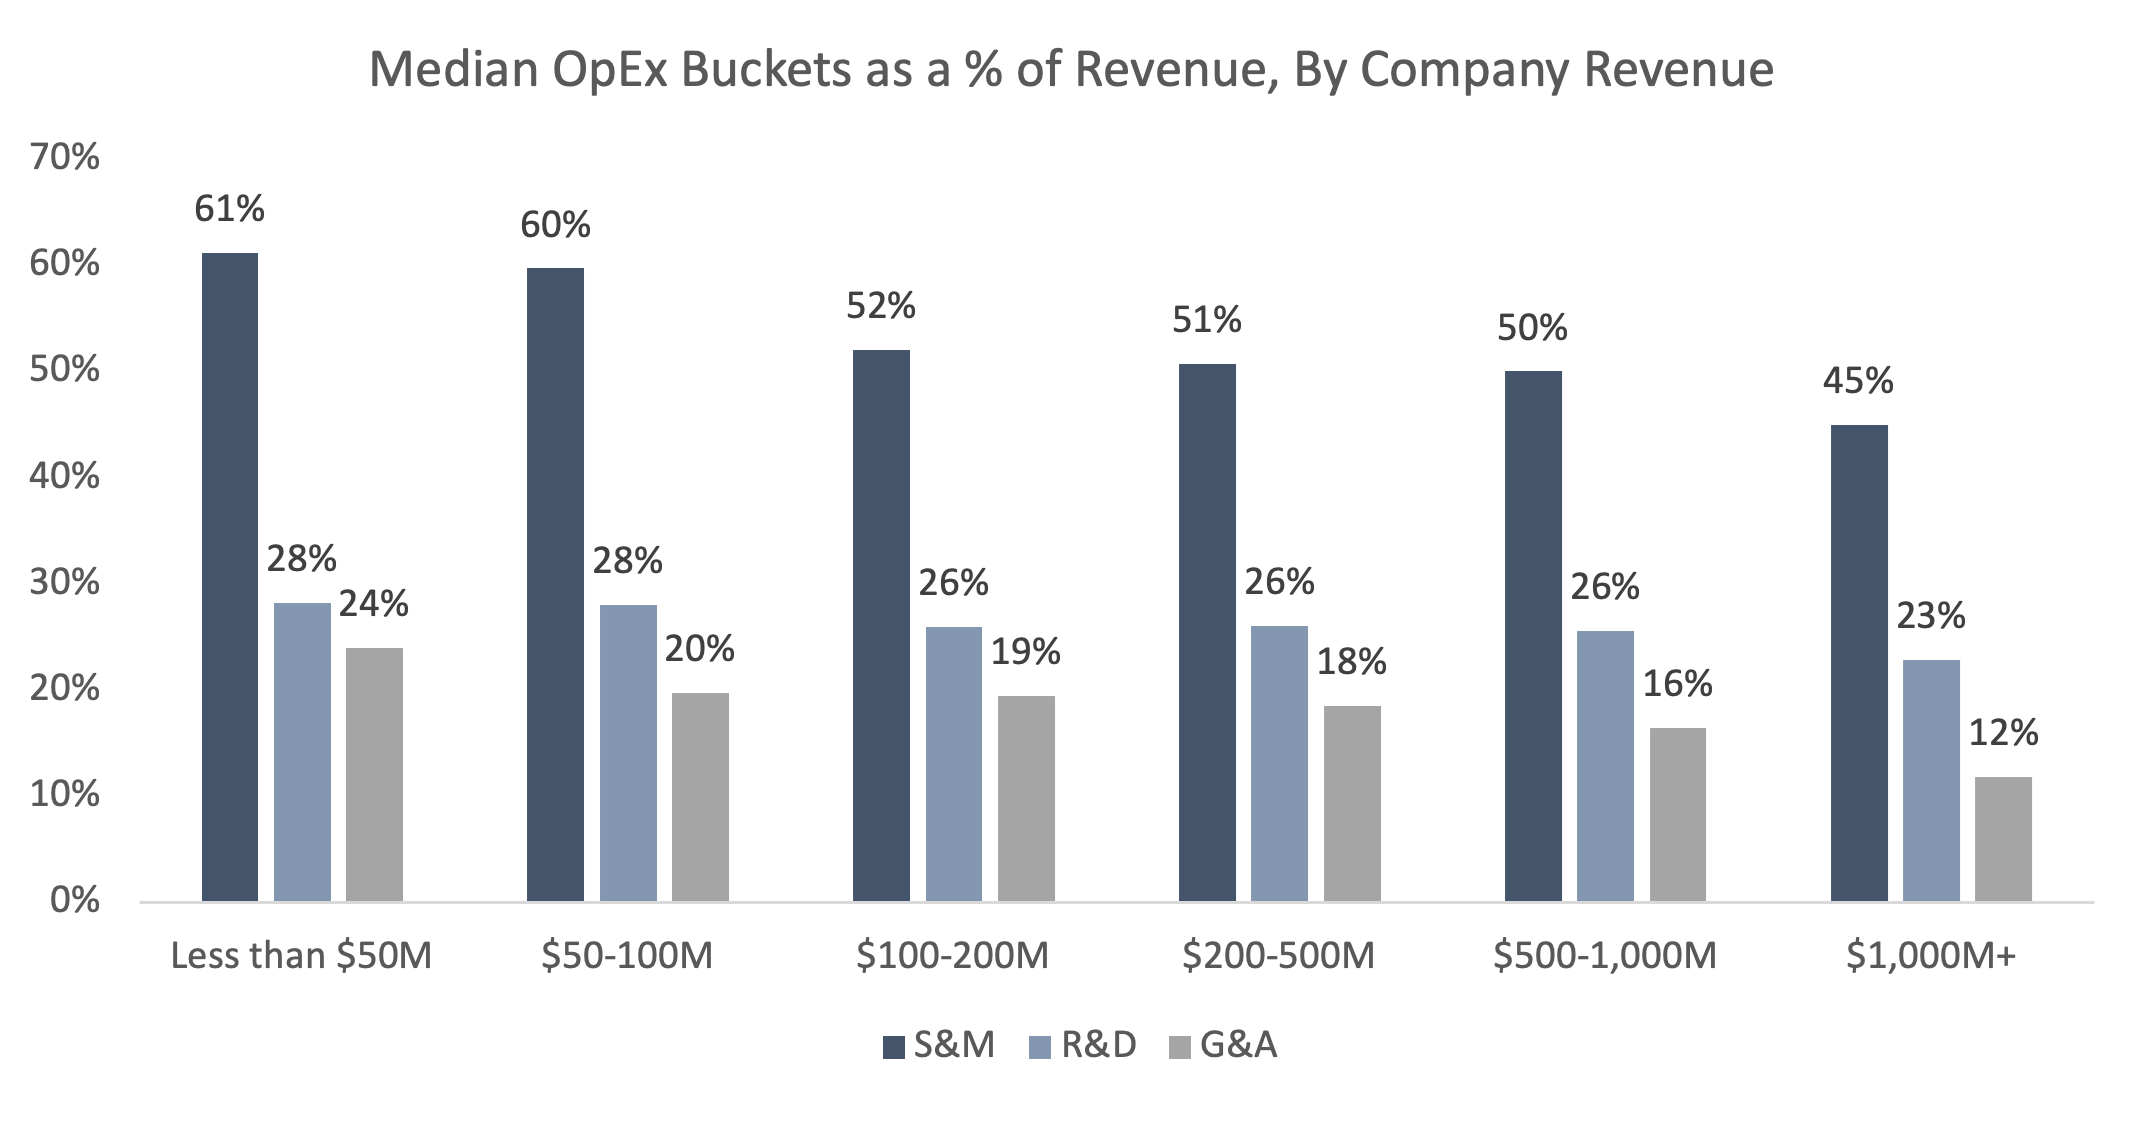
We have access to many of these public SaaS companies’ financials when they were private companies, both via public filings and due to our diligence on the companies when they were private. The trendlines from this data are clear (charted below): S&M spend accounts for the largest portion of operating expenses, but also decreases the most on an absolute percentage basis over time. This suggests that market tailwinds and product-market fit are critical to maintaining growth when you decide to pull the S&M lever to push toward profitability.
Expand 
SOURCE: Internal Sapphire Analysis, CapIQ
Sapphire’s SaaS Operating Model
To help make these benchmarks more tangible, and more clearly show how they impact profitability for a Series B/C startup, we’re bringing back the model template from our previous blog with our partner Rajeev Dham. We modeled the template using the following assumptions (*):
- 75% initial growth rate persistence (i.e., the company’s growth rate is 75% of the previous year’s growth rate)
- Gross Margin: 77%
- ARR to GAAP translation based on historical data
- S&M, R&D, and G&A based on historical data.
We encourage you to download your own copy of the model and toggle the assumptions to understand what it might take to get to future profitability.
Our biggest takeaway from experimenting with the template model? The typical “high growth” SaaS company often has a long journey to become cash flow positive. According to the model, even with strong underlying metrics and efficiency, it takes this template company 7 years from its Series B to have a positive operating margin. (And as a founder, it’s critical to find a VC that’s the right fit, as they will be funding your business this entire time!)
Sales Efficiency at Scale
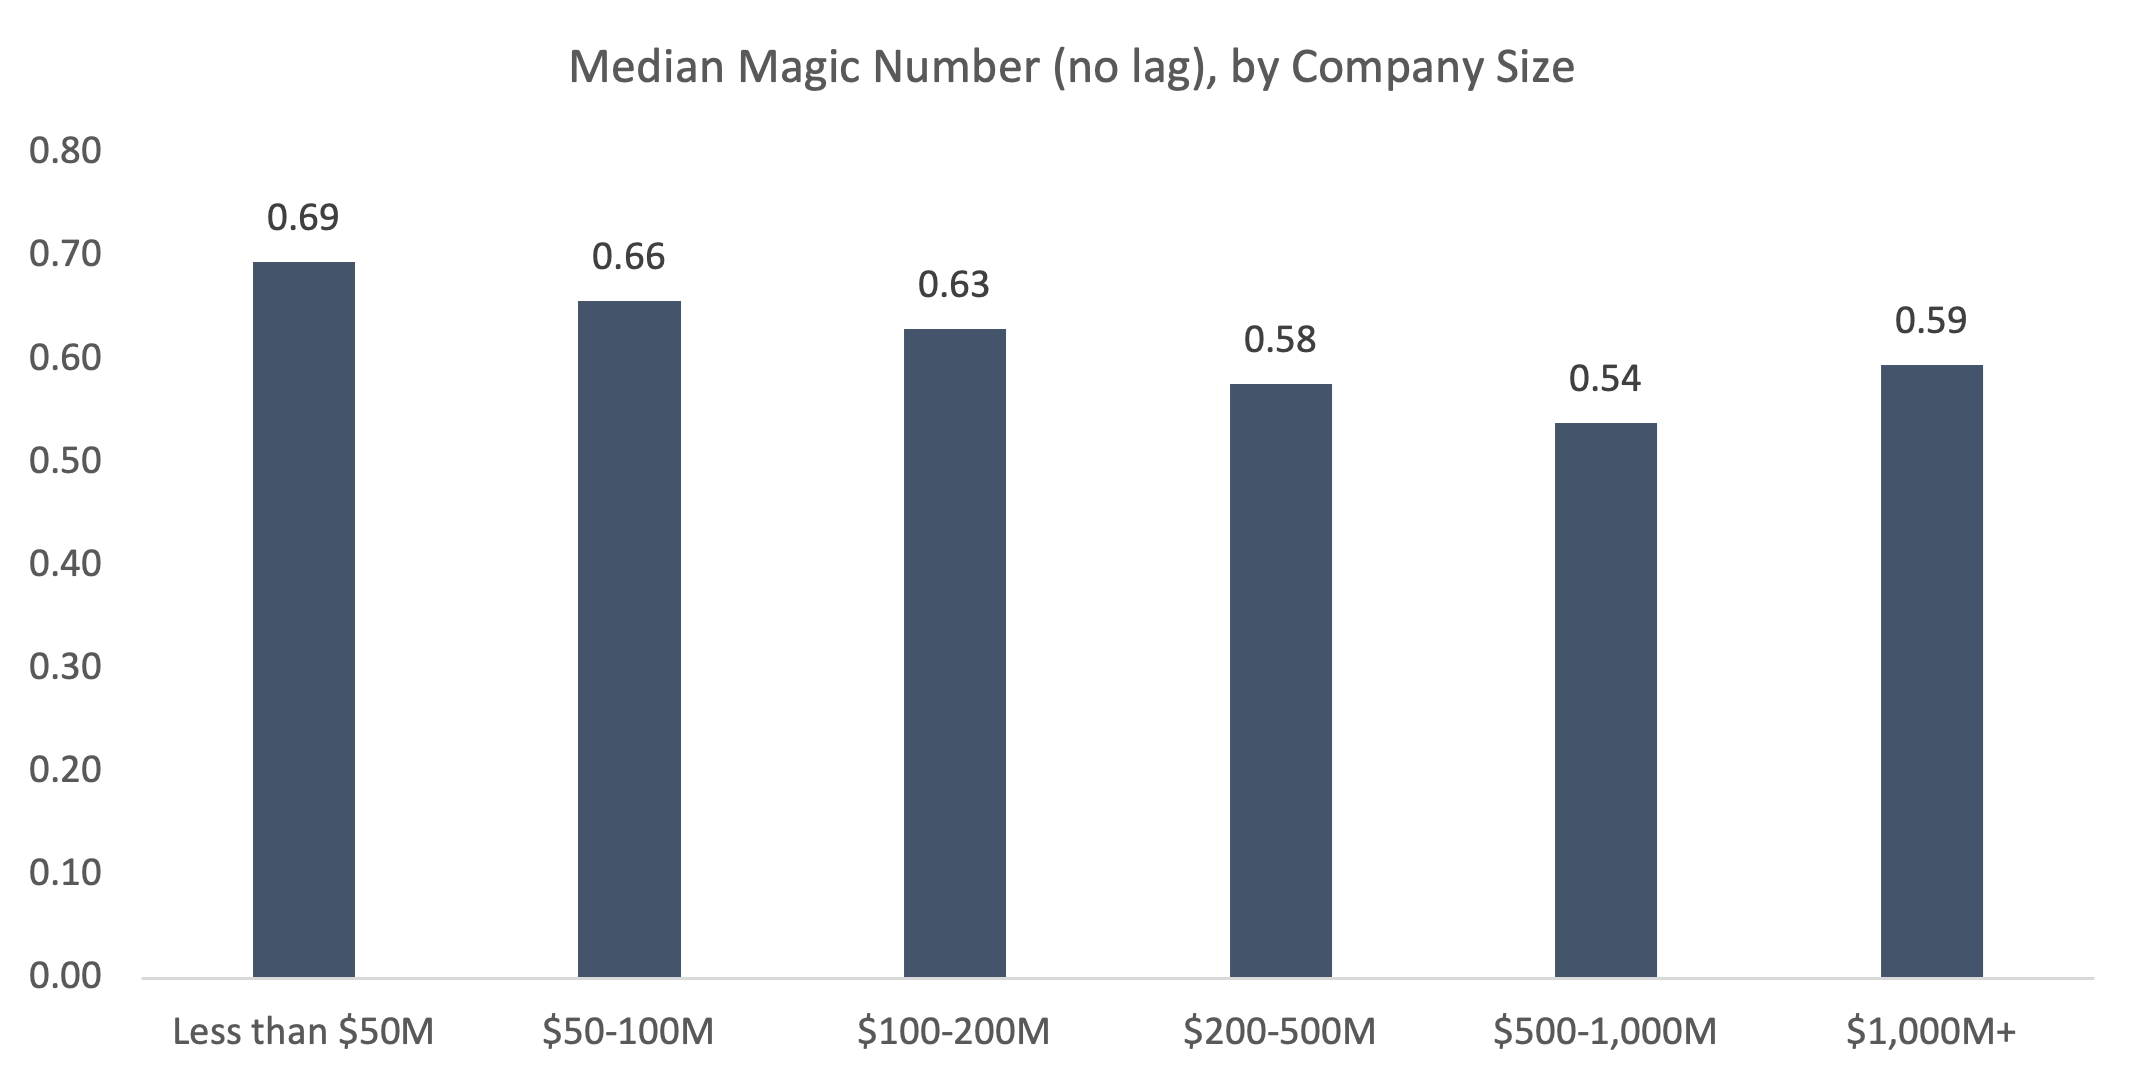
It is no easy feat to reach cash-flow positive. One thing we often hear from start-ups in their quest for profitability is that “sales efficiency will increase with scale.” This seems like a reasonable assumption, as continued topline growth combines with a better cost structure (which makes intuitive sense). But when looking at data for SaaS companies that went public, we found this assumption wasn’t always true. Efficiency decreased until they reached ~$1B+ in revenue, at which point it ticked back up slightly.
Expand 
SOURCE: Internal Sapphire Analysis, CapIQ
We think this trend is generally explained by three things:
- A company’s success signals that this new space is a “hot” market, attracting competition (making it harder to sell your products).
- The first few waves of buyers of your product are often “low hanging fruit” – after you’ve sold to the “obvious” and “easy to sell to” customers, sales teams must learn how to sell efficiently into broader customer segments.
- Only at true scale, as companies exit “hypergrowth” mode, do efficiency gains begin to materialize; this is driven partially by economies of scale, as well as the fact that $1B+ in revenue suggests market leadership, which makes selling easier.
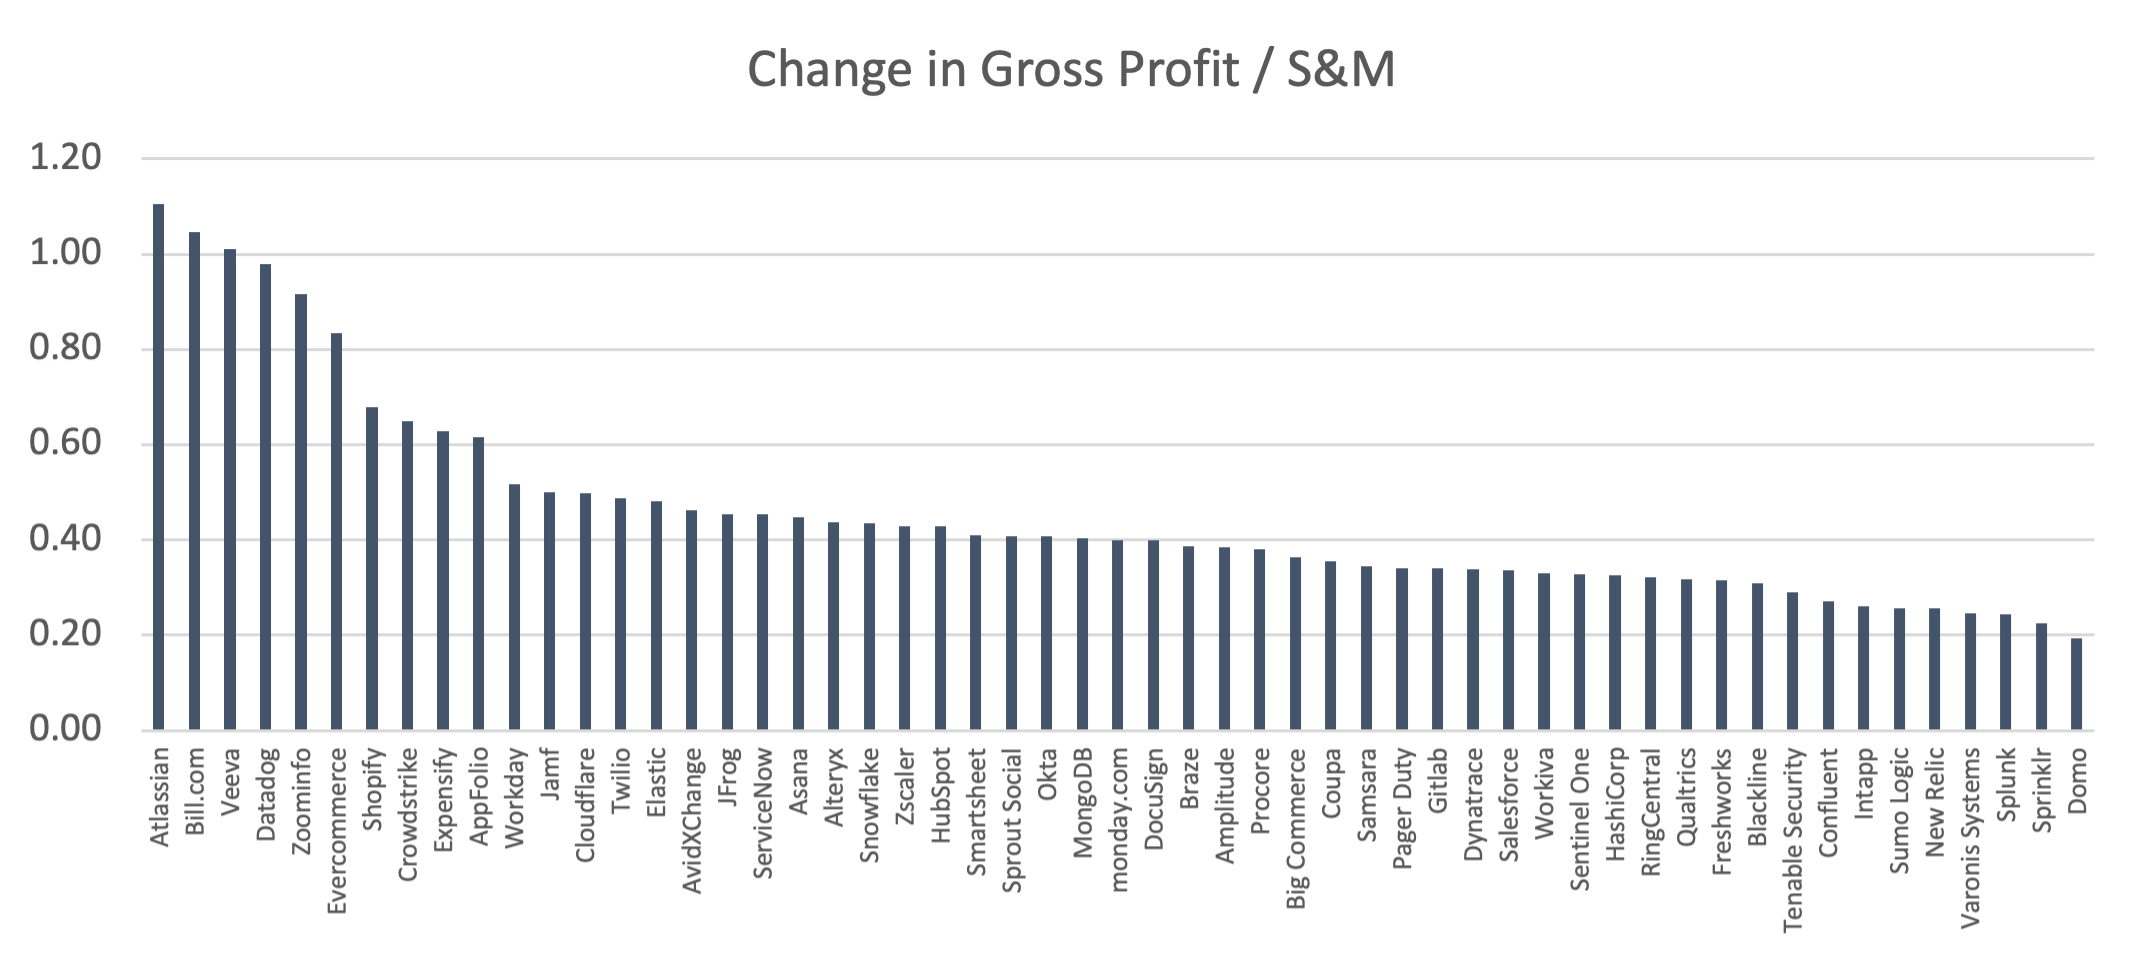
We took another look at the data to underscore the difference in efficiency across companies. The below chart compares the change in gross profit for the most recent FY with the earliest FY that we have access to, divided by total S&M spend over that period. Take Atlassian as an example (a darling of the efficiency-focused crowd). Their most recent gross profit was ~$2.3B, compared to ~$60M in their earliest reporting year. Over that same period, they spent ~$2.B on S&M. This is incredible efficiency at translating S&M spend into gross profit. Note that our next set of blogs will focus on the often-overlooked impact of gross margin on profitability.
You’ll note in the chart that, as you’d expect, some of the most richly valued companies (on a revenue multiple perspective) are on the left.
Expand 
SOURCE: Internal Sapphire Analysis, CapIQ
What Does All This Mean for Start-Up Founders?
We think investors pounding the table issuing dire warnings for start-ups to become cash-flow positive are a bit unrealistic and short-sighted. If a start-up is tackling a large underpenetrated market, we suggest they focus on growth first – efficient growth. At Sapphire, we are encouraging our management teams to continue to grow their businesses, while managing burn responsibly and building efficient processes today. Given the cost structures of SaaS companies, and what it takes to fuel growth in competitive industries, we think most companies should not “turn off” spending, but instead manage toward a clear goal of having strong unit economics and being EBIT positive at a reasonable time in the future.
We believe capital markets will bounce back, and companies with a demonstrated history of efficient growth building differentiated products in large markets will be able to raise future growth capital at attractive prices. At Sapphire, we continue to look for and fund these types of businesses. Like we’ve said previously, we believe SaaS is both the present and the future – and that we’re in the early innings of the Cloud transformation.
Please reach out to Steve Abbott ([email protected]), Rajeev Dham ([email protected]) or Andrew Vogeley ([email protected]) if you’re building a SaaS company with a goal to scale into being a next gen Company of Consequence.