Over the last few months, as we began to help our portfolio companies reframe how they think about the goals of growth vs. longer-term cash generation, we came to believe there were few resources that simply and clearly explain how the different parts of a SaaS business come together to generate cash, and how multiple compression, revenue growth rates, and interest rates all ultimately impact how valuations are set. In this three-part series, our aim is to unpack the various components and drivers.
In Part I of this series, we look at how the reduction in equity values is tied to rising interest rates. We also explain the math that is driving the relative differences in value reduction for public tech companies. Parts II and III will apply some of these lessons to help inform private software companies and what it might take to achieve a premium valuation at scale.
Impact of Interest Rates
Over the last several years, we have often seen the public markets value revenue growth over cash generation. Multiples for high-growth companies have generally far outpaced slower growers. We believe this wasn’t just sentiment-driven investing, but rather the transition to growth-first from growth + cash flow that is largely backed-up by math we will explain below.
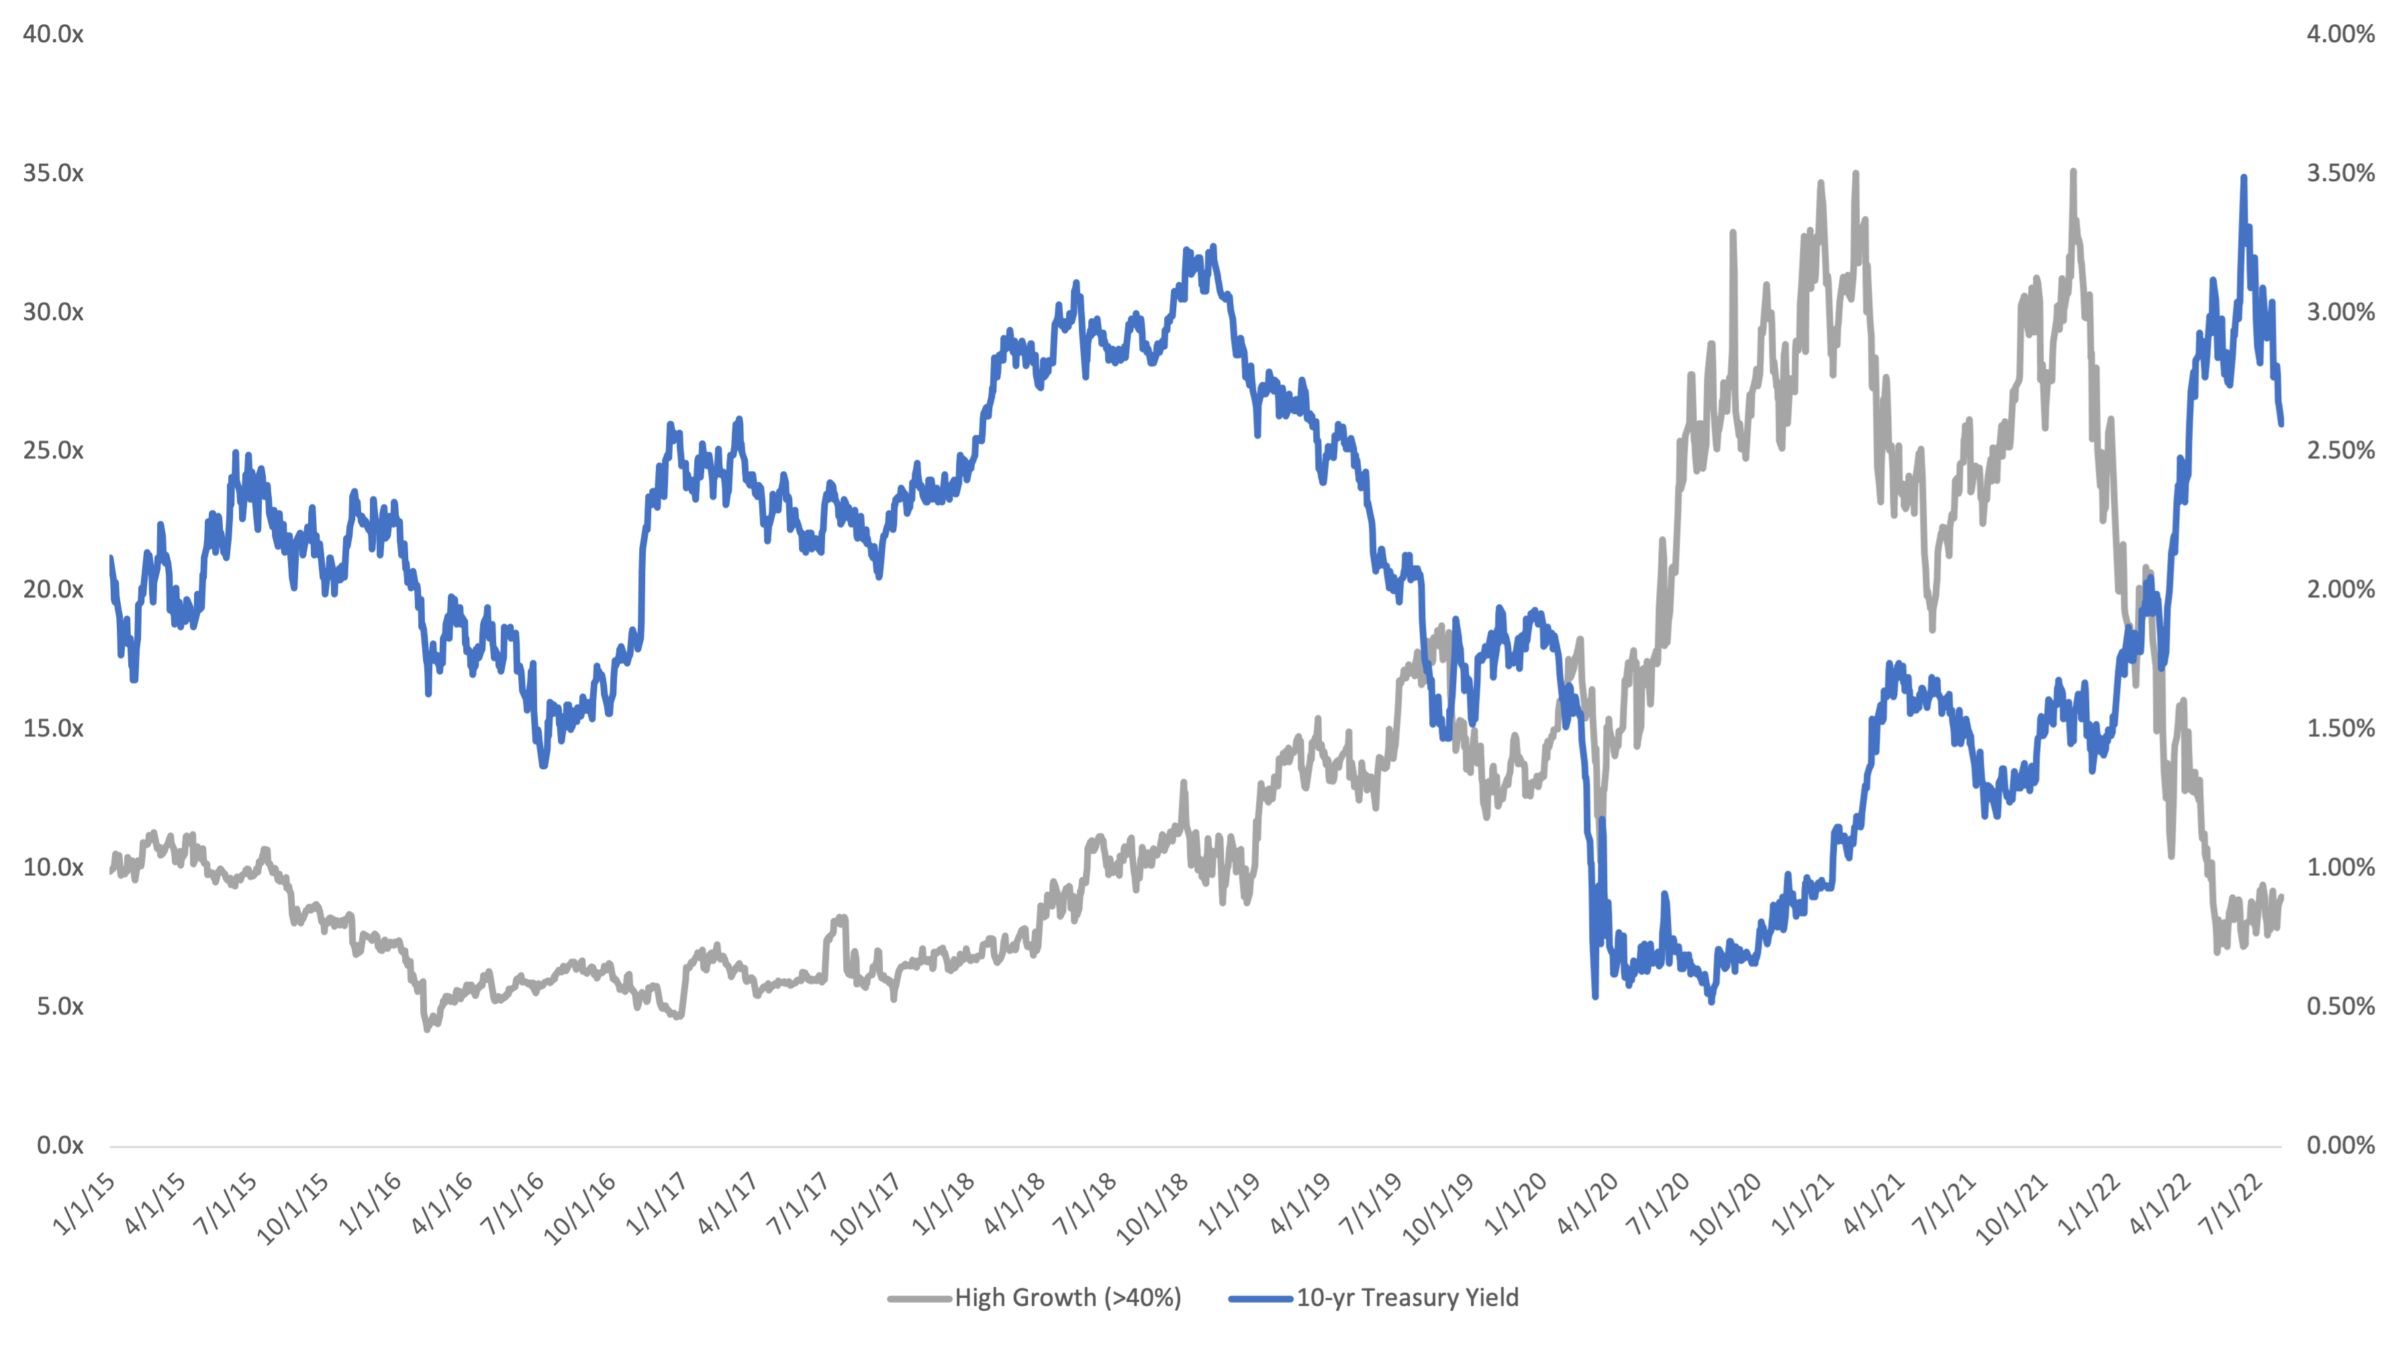
While many have seen an ostensibly higher quality of SaaS companies matriculate to the public markets in the last five years, much of the valuation expansion experienced was driven by low interest rates. Starting in late 2018, the yield on the 10-year Treasury – a proxy for investor sentiment regarding future interest rates – began falling. Around the same time, SaaS revenue multiples began accelerating.
Because Treasury Bonds that are returning 1% won’t usually help an investor hit their return thresholds, investors most often seek assets that can generate higher returns – these assets came in the form of high-growth SaaS companies.
On the flip side, when Treasury yields began rising, particularly in late 2021 and early 2022, SaaS multiples began to fall. The relationship isn’t 1-to-1, but the correlation is strong.
10-yr Treasury Yield vs. High Growth SaaS NTM Multiples
Expand 
Source: CapIQ, Public Comps (B2B SaaS)
But why? Because the interest rate impacts the value of the future cash flows (which is what investors have generally always cared about). The further into the future we expect a cash flow, the more we discount it (see, “Time Value of Money”). As interest rates rise, those future cash flows become worth less in today’s dollars. And because many high-growth companies won’t become cash-flow positive for ~3-5 years after going public, much of the value of the company is in the out years’ cash flows or the “terminal value,” which is hit even harder in a rising rate environment.
The terminal value is the value assigned to all future cash flows beyond the ones that are forecasted in a discounted cash flow model. Practically speaking, analysts often model 5-10 years into the future with any degree of certainty. But how we think a company performs in years 11-20 and beyond will have an impact on how much we’re willing to pay for a share of the company today. Because of this, we must estimate the value of those distant future cash flows – hence the need for a terminal value.
When interest rates rise, the terminal value declines because the cost of capital, or the discount rate, is increasing. The full formula is here(*), but the key point: as interest rates increase, debt becomes more expensive (via higher interest payments) and the cost of equity increases, as lower risk assets (like government bonds) now promise a higher rate of return. For higher-risk assets (like growth tech companies), this means they must offer (and strive for) an even higher rate of return. As a result, future cash flows must be discounted by a higher discount rate, lower the overall value of the company (note that this generally assumes all other factors are equal).
And this is often borne out in the data. Strong cash generating companies like Google and Microsoft are only down ~20% YTD, while a high-growth, cash-burning company like Asana is down ~75% YTD. A company like Datadog, which generates cash but is still a high-grower, is in the middle, down ~40% YTD.1 We believe that since the cash flow positive companies are generating more near-term cash than the cash flow negative companies, they are less impacted by rising rates. However, companies like Datadog still have more value tied in the terminal value, compared to Google or Microsoft, and so are hit harder than near-term strong cash generators.
To illustrate the difference in interest-rate impact on valuation of different profile companies, we put together a simplified model, using “rule of thumb” metrics and assumptions for an illustrative high-growth SaaS company at IPO (“HG SaaS”).
Notable takeaways:
- 91% of the HG SaaS enterprise value comes from the terminal value, as the company is not cash flow positive for several years. Put simply: almost all of the company’s value comes from far-in-the-future cash flows
- The company’s valuation is sensitive to the interest rate assumptions we make. Moving the risk-free rate from 3% to 4% decreases the enterprise value by ~10%. If the risk-free rate was 0.5% (which it was for much of Covid), our example company has an enterprise value that is almost 50% higher than when the risk-free rate is 3%
- In comparison, Microsoft, a business that is growing slower, but producing meaningful cash flows (~35% FCF margin) has only 36% of its enterprise value tied to the terminal value2
Use this link to access this simplified model and test your own assumptions. While factors beyond interest rates impact valuations, it is undeniable that interest rates play a critical part. And while rising interest rates generally affect all equities, they often do not affect them equally, even within tech. Practically speaking, companies with more efficient cost structures and those that are strong “Rule of 40” companies are likely to be relatively higher valued in this environment.
Stay tuned for Part II, where we dive deeper into how we believe private SaaS companies can drive to profitability and the mechanics of what it takes to become cash flow positive.
Thank you to Steve Abbott, Partner and Head of Capital Markets, for his input on this series. Contact Rajeev Dham at [email protected] and Andrew Vogeley at [email protected]