As we continue delving into the metrics and mechanics of high-growth SaaS businesses, we wanted to focus on two areas we rarely see discussed: gross margin and gross retention.
When founders ask investors for guidance on gross margin (GM) and gross retention benchmarks, they are often met with a shrug, or a default response somewhere along the lines of: “Be above 70% for gross margin and 90% for gross retention, and you’ll be fine.” You can then expect the investor to mention sales efficiency and/or net dollar retention (NDR) as key SaaS metrics to focus on.
While we agree that those metrics are important for SaaS business, we argue that GM and gross retention are simple underappreciated metrics that quietly carry a lot of impact. We believe that’s especially true in a valuation environment that places a premium on efficient growth: higher gross margin and gross retention enable SaaS businesses to grow faster by giving them more dollars to reinvest in efficient growth. In other words, these two metrics can be key drivers of growth.
High Gross Margins are Integral to the Power of the Software Business Model
Why do so many equity (and even debt) investors strive to invest behind “software” gross margins, which typically means 70%+ for most companies or 80%+ for best-in-class firms? Because these types of margins can drive incredible leverage in the business.
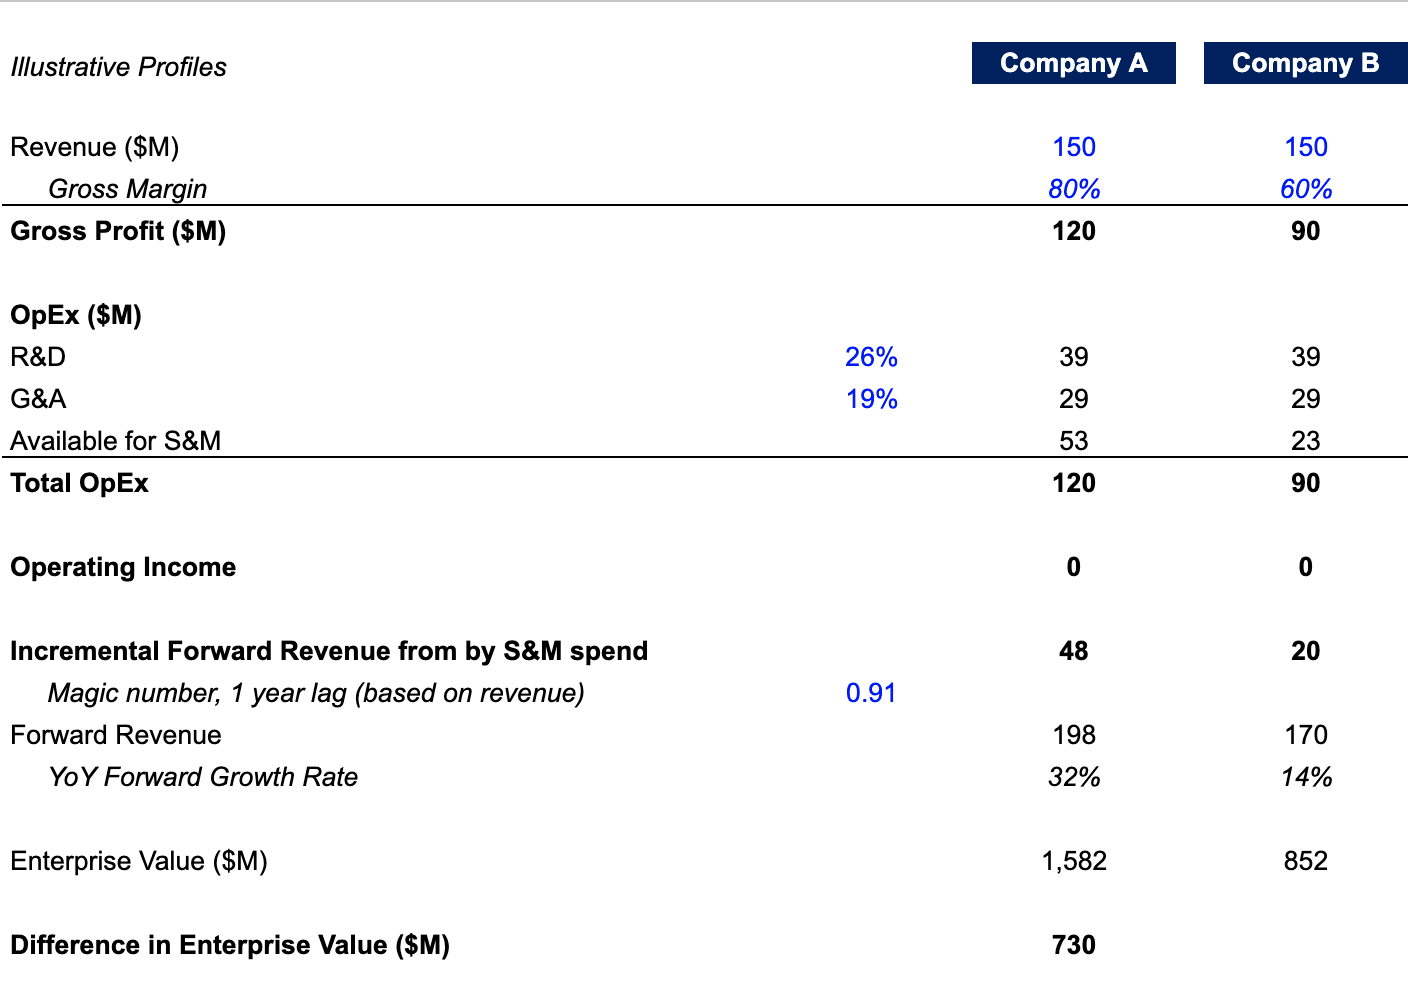
Let’s take a look at two illustrative companies depicted in the graphic below, both at $150M revenue. Company A has a GM profile of 80% and Company B 60%. This 20% delta in gross margin means that Company A has $30M more to spend in sales and marketing (S&M) than Company B, which can result in higher growth, a quicker path to profitability, or both.
Assuming each company invests the entire amount in S&M, we can translate that investment into future revenue, based on benchmark magic numbers for businesses at this scale. At a median magic number of ~0.9 (with a one-year lag), Company A will drive $48M of forward incremental revenue from this S&M spend, while Company B will drive just $20M of revenue. This means that higher gross margins are not just a profitability lever, but they can also be a competitive weapon to drive higher growth rates.
Company A’s growth is solid at scale (especially if we assume it is operating at breakeven), but Company B’s growth rate is less impressive when we apply current public market comps to these companies. Because Company A is growing faster, it commands a higher forward revenue multiple (~8x) than Company B (~5x, which is generous for 14% growth), and the resulting difference in enterprise value is more than $700M+. For two companies that otherwise execute comparably (i.e., produce the same product with the same level of research and development (R&D) investment and have the same sales efficiency), a 20-point difference in GM translates to one company being worth almost double the other company!
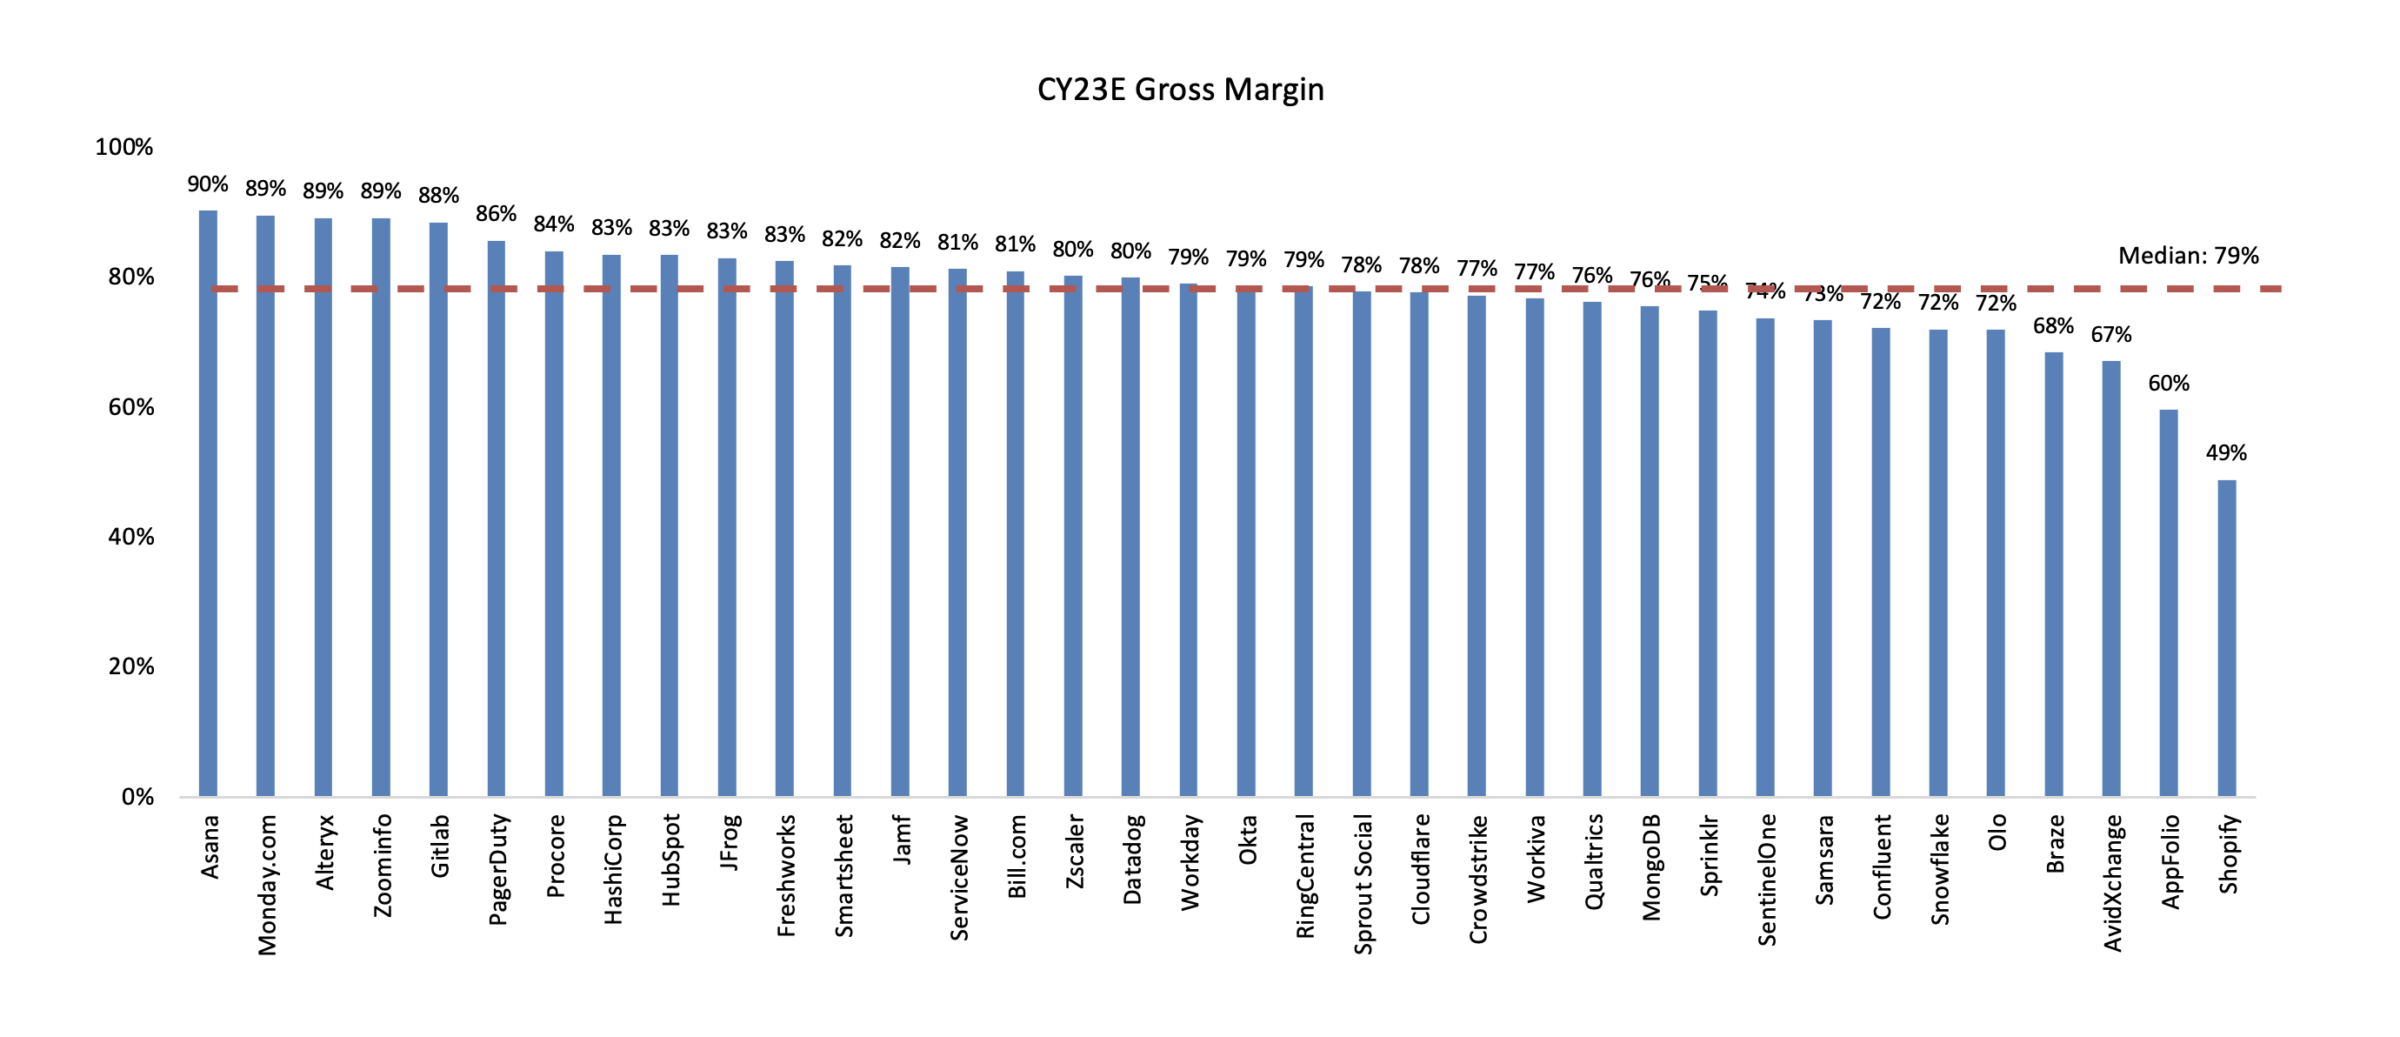
Sapphire has built a Gross Margin and Gross Retention Impact Template* if you want to input assumptions for your own company to see the leverage improved GMs can give you. If you need additional proof, the median gross margin for the top 10 most highly-valued SaaS companies today is 78%. These businesses drive leverage in their operating model through high gross margins, enabling them to invest incremental dollars in growth and/or harvest for cash flow. The overall median for growth SaaS is also at 79%.
Expand 
As of 6/2/23; Source: CapIQ
High Gross Retention Further Drives Efficient Growth
We see a similar dynamic with gross retention: it can not only serve as a metric to measure churn, but also an important lever to drive efficient growth. The key reason for this is the simple fact that retaining and expanding an existing customer is almost always cheaper than acquiring a new one. Every dollar that a company retains is a dollar that they can grow over time. Instead of incremental S&M expense for account executives or paid ads to chase new customers, companies can invest in more efficient channels of customer success or product-led expansion to retain and grow customers.
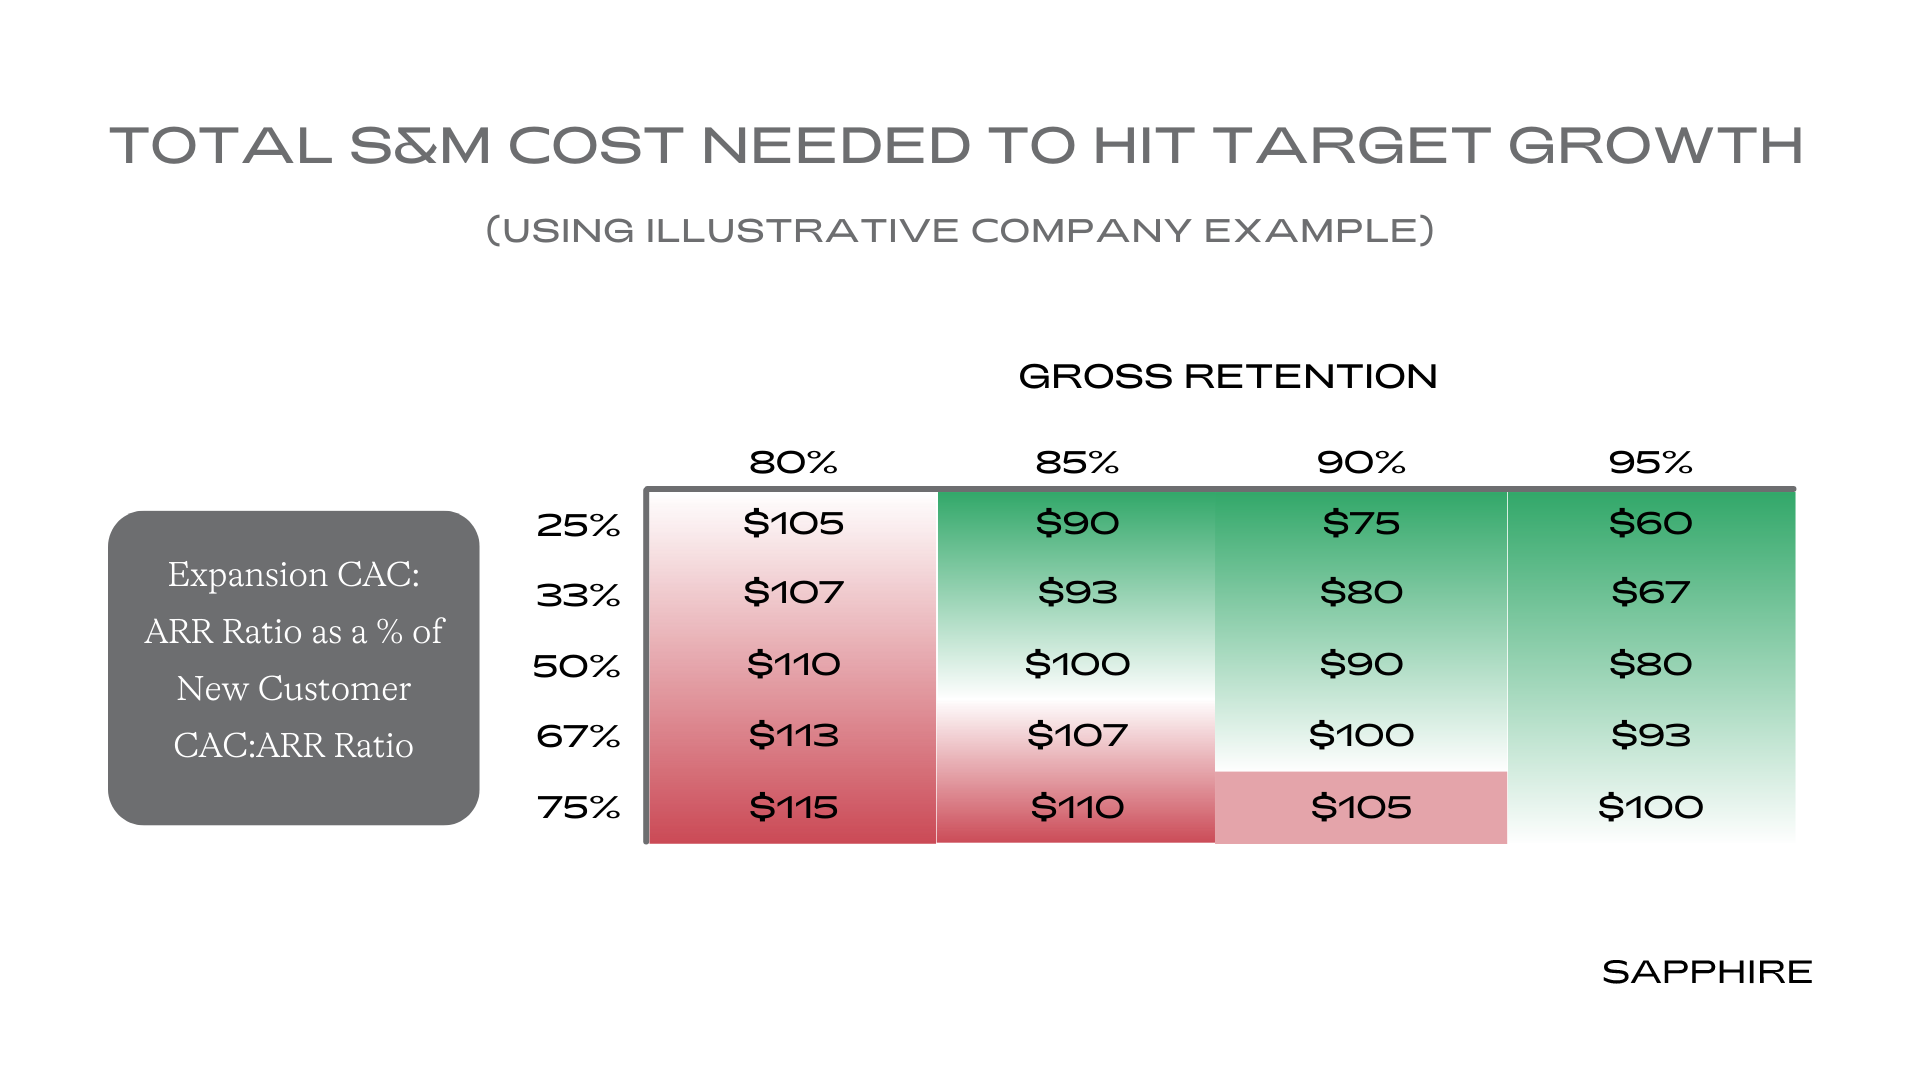
Let’s look at another illustrative example: Company A is sitting at $200M ARR, wants to grow 30% YoY next year, and spends $2 in customer acquisition cost (CAC) for every $1 of new customer ARR. The company needs to achieve $60M net new ARR (NNARR) to hit its growth targets. If $30M of the $60M target NNARR comes from expanding and growing existing customers, while the other $30M of NNARR comes from acquiring new customers, and if CAC for expansion ARR is twice as efficient as for new ARR, then the company will need to spend $90M on S&M.
But what happens if the company improves its gross retention from 90% to 95%? Total CAC for the $60M NNARR drops to $80M (from $90M), as expansion revenue makes up a larger percentage of the total NNARR. Say the company were to get even more efficient at driving expansion ARR, through thoughtful in-app expansion opportunities, for example, and reduce expansion CAC to 25% of new customer CAC: total S&M spend for the target $60M NNARR would fall to $60M (down 33% from our “base case” of $90M). You can see this sensitized in the tables below:
This improvement in gross retention gives the company incredible optionality. Management can either take incremental savings from the gross retention improvement and reinvest in further growth (hiring more salespeople, for example), or focus on a path to profitability at the same level of growth. Our Gross Margin and Gross Retention Impact Template* shows this in action (and lays out all of the assumptions that go into the sensitivity analysis above).
Not So Gross After All
As you hopefully appreciate by now, gross margin and gross retention are simple but powerful metrics that can help SaaS companies propel growth. While there is no one path to reaching efficient growth at scale, we encourage founders to consider these foundational metrics to help them succeed.
If you’re scaling a SaaS company to become a next gen Company of Consequence and interested in learning more, reach out to Rajeev Dham ([email protected]), Steve Abbott ([email protected]) or Andrew Vogeley ([email protected]).
Legal disclaimer
Disclaimer: Nothing presented within this article is intended to constitute investment advice, and under no circumstances should any information provided herein be used or considered as an offer to sell or a solicitation of an offer to buy an interest in any investment fund managed by Sapphire Ventures (“Sapphire”). Information provided reflects Sapphires’ views as of a time, whereby such views are subject to change at any point and Sapphire shall not be obligated to provide notice of any change. Sapphire does not make any representation as to the accuracy or completeness of information provided herein.
(*)The ”Gross Margin and Gross Retention Impact Template” provided by Sapphire is for informational purposes only and is in no way intended to constitute investment advice. Although Sapphire has provided and described various assumptions within this article and the model, many other factors may impact any practical outcome that is estimated therein. While Sapphire has used reasonable efforts to present observations from analysis using the internal model presented, Sapphire makes no representations or warranties as to the accuracy, reliability, or completeness of observations presented within this article, analysis, or the model itself. All metrics and observations presented within this article must be considered academic and hypothetical in nature and are in no way guaranteed in actual practice. Such observations are based on numerous assumptions, are subject to change at any point and do not in any way represent official statements by Sapphire. No assurance can be given that all material assumptions have been considered in connection with the analysis in this article and the model, therefore actual results will vary from those estimated therein.
Due to various risks and uncertainties, actual events, results or the actual experience may differ materially from those reflected or contemplated in these statements. Nothing contained in this article may be relied upon as a guarantee or assurance as to the future success of any particular company. Past performance is not indicative of future results.