Necessity is the mother of invention, yet it often sows seeds of complexity. As applications have evolved to meet user demand for more sophisticated, performant and personalized experiences, the complexity of their underlying architectures and componentry has intensified. Because of this, effective monitoring and debugging is crucial to any product’s success. However, achieving high fidelity often requires advanced tooling and expertise to properly instrument apps across distributed architectures, multi-cloud environments, third-party API integrations, embedded machine learning models, web/mobile/edge deployments, etc.
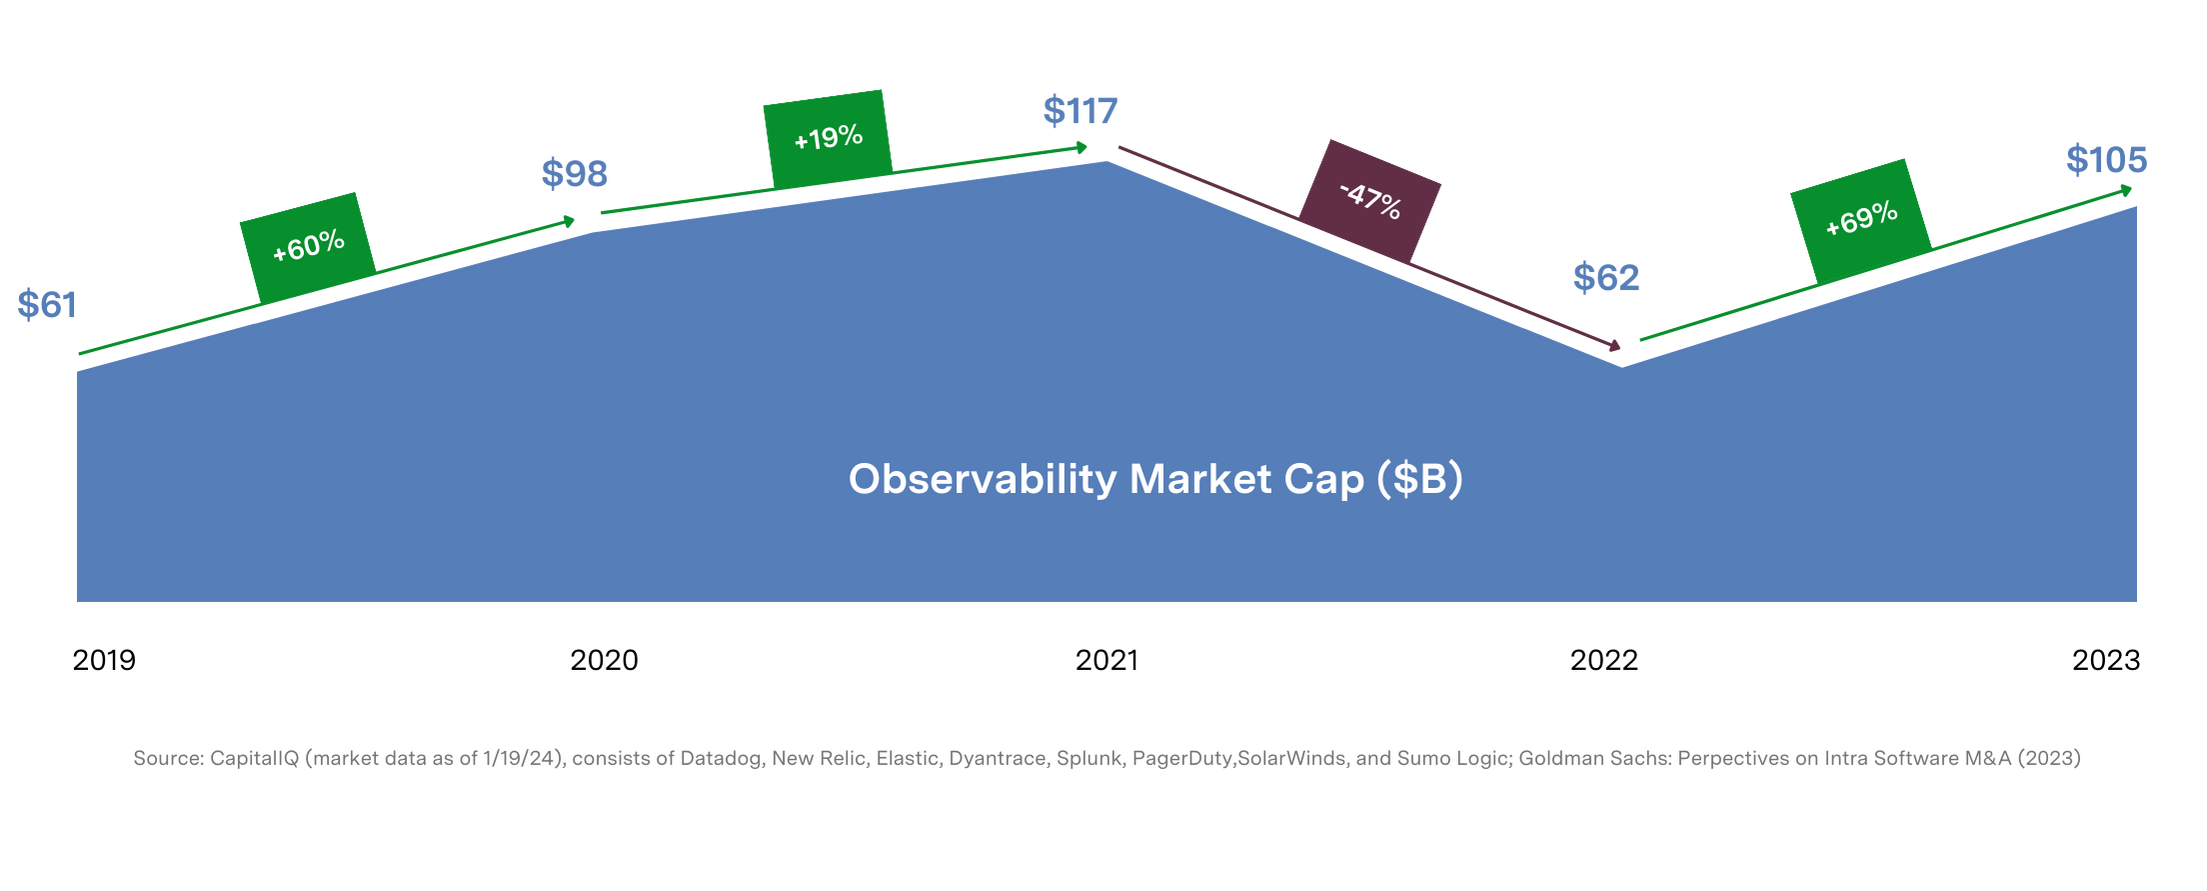
Data consistency is a common observability challenge. Each component within these intricate systems will often emit its own unique telemetry format, leading to continuous streams of mixed signals for SREs (Site Reliability Engineers) to decode. Not only is data processing and correlation a challenge, but so is managing its compounded growth, which some analysts estimate as high as ~23% YoY.* These complexities lead to escalating infrastructure, software and engineering resource costs, often without proportionally increasing insights.
Furthermore, the industry struggles to provide coverage across all phases and personas of the product life cycle. We believe the scope of observability is expanding, and no longer limited to classical definitions around systems and IT operations. This includes a ‘shift left’ to provide developers with faster and more effective troubleshooting, debugging and code-level monitoring, as well as a ‘shift right’ to provide business stakeholders visibility into customer usage and behaviors influencing product KPIs.
Finally, as the aperture of modern applications expands, the industry must continuously extend instrumentation to new environments and emerging workload types such as LLM-powered components.
These challenges are opening the door for a next generation of disruptors that can promise greater coverage, interoperability and cost efficiency, without sacrificing depth or clarity of insight. In recent years, the industry has experienced a fresh wave of innovative new capabilities and approaches to observability, including data pipelines, in-stream analytics, database and storage layer optimizations, AI-powered root cause analysis, standardized data formats and more.
Sapphire Ventures has been fortunate to back some incredible companies across the observability ecosystem over the years, including Sumo Logic (log analytics), Catchpoint (synthetic monitoring), OpsRamp (AI-Ops), InfluxData (time-series DB), Exabeam (SIEM), Moveworks (AI-Ops) and Weights & Biases (ML experimentation & LLM tracing). Working with each of these teams has given us a unique vantage point into the market and, as the observability ecosystem evolves, we’re excited to share our perspective on the key trends shaping this space in 2024 and beyond:
- Observability Pipelines providing real-time filtering, enrichment, normalization and routing of telemetry data
- Insertion of LLMs to simplify the user experience and enhance both analytics and downstream automation
- Emergence of AI/ML Observability tools to help monitor and optimize AI/ML workloads
- Industry-Wide Standardization and OpenTelemetry
- Bring-Your-Own Storage Backend to enable more flexible and efficient utilization of infrastructure
- Visibility into the CI Pipeline to optimize end-to-end software development processes
- Linking Business Outcomes to Systems Data to correlate product-level data with backend performance
Keep reading for our perspective on each of these trends and the current landscape of startups we believe are paving the way.
2024 Observability (O11y) Trends
– Observability Pipelines
As data volumes and costs continue to rise, organizations are requiring more granular control over their telemetry data, from collecting, processing and routing to storage and archival. One approach that’s gained significant traction is observability (o11y) pipelines, which have emerged as a powerful way to lower overall ingestion costs and volumes.
Pipelines serve as a telemetry gateway and perform real-time filtering, enrichment, normalization and routing, often to cheap/deep storage options such as AWS S3, reducing dependencies on more expensive and proprietary indexers. In addition to cost savings, another common benefit we see, particularly in the enterprise, is data (re)formatting. In this case, pipeline customers convert legacy data structures to more standards-based formats on the fly (e.g., OpenTelemetry, see trend #4), without needing to ‘touch’ or reinstrument legacy code bases.
Data pipelines are packaged as both standalone solutions or as a native subcomponent of a broader observability suite. Regardless of starting position, we believe players in this space will continue to expand, supporting a wider range of operational use cases over time (e.g., Cribl has expanded beyond pipelines into app monitoring w/ AppScope).
– Insertion of Large Language Models (LLMs)
The observability market has used traditional ML models for years to provide anomaly detection, capacity forecasts, outage detection and other predictive capabilities. More recently, platform providers have started using LLMs to inject additional intelligence into their offerings and simplify the overall user experience.
LLMs are enabling users to more easily configure platforms, instrument applications, create dashboards and assemble queries, translating natural language prompts into platform-specific commands and syntax. Once a baseline configuration is established, LLMs can also learn and adapt over time. For example, they can personalize the management console to show frequently viewed app components and associated metrics based on user affinity and previous interactions. This extends beyond individual personalization, to exposing tribal knowledge across teams, particularly in response to major incidents. “If you’re using GenAI to extract and analyze data about how people work and what makes coordination difficult during incident response, you can leverage those insights to determine what tools are most beneficial to engineers and intelligently surface them as needed,” says Nora Jones, Sr. Director of Product at PagerDuty.
LLMs are also making it easier to understand complex system alerts, translating esoteric technical jargon to more human readable sentences. Because LLMs can ingest and analyze large volumes of unstructured data, companies like Flip.ai are finding new ways to apply them to more traditional log analytics and AI-Ops capabilities, identifying patterns, inferring meaning (e.g., sentiment analysis of user feedback) and determining root cause across complex systems.
Finally, as the predictability and explainability of LLMs improve over time, we expect them to start making decisions on their own. Agentic capabilities, or the capacity for decision-making, are likely to manifest, particularly in support of incident management workflows, where models will be granted autonomy to both assemble runbooks on the fly and take steps to execute potential downstream fixes.
It’s important to note that while the application of LLMs to o11y is promising, their effectiveness in interpreting technical data and generating actionable insights, without significant domain customization and use of case-specific training, remains a significant hurdle.
– Emergence of AI/ML Observability
As the AI hype cycle has accelerated, we’ve seen an explosion of new tools and capabilities to support the end-to-end model development lifecycle, from experimentation to production deployment. Critical to the continued advancement of state-of-the-art models, model monitoring tools help validate the integrity and reliability of AI/ML applications, particularly as production models and their training datasets evolve over time.
In addition to monitoring more traditional health metrics, like CPU utilization and response time, emerging model monitoring platforms assess additional concerns such as model performance (e.g., recurring checks against a defined evaluation metric, such as PPV), drift (e.g., detecting statistical variations between models at training time vs. production) and data quality (e.g., cardinality shifts, mismatched types).
An evolving aspect of this domain we are particularly excited about is LLM observability. This discipline builds on traditional ML monitoring to capture important signals related to building, tuning and operating LLMs in the wild. For example, companies like Weights & Biases support LLM tracing, which enables teams to visualize and monitor prompt inputs, intermediary predictions, token usage and more as transactions execute along a multi-staged LLM chain. Additionally, next-gen product analytics tools are coming to market from companies like Aquarium Learning, which provide visibility into user interactions with LLM-powered interfaces (e.g., correlating common topics and user behaviors with product metrics to prioritize backlogs and inform roadmaps). Finally, we see platforms expanding to provide pattern identification and drift detection of unstructured data entities, such as vectorized embeddings, to improve the accuracy of RAG-based workflows.
– Industry-Wide Standardization and OpenTelemetry
Historically, the observability market has been dominated by incumbents with proprietary data formats. This has created a ‘Hotel California’ lock-in scenario, forcing organizations to integrate and administer a complex universe of disjointed monitoring solutions.
Over time, the community recognized the limitations of proprietary data formats and began collaborating on open standards, with the OpenTelemetry project leading the charge. OpenTelemetry (aka OTel) is an open standard set of wire specs, APIs, SDKs, tooling and plug-ins for collecting and routing telemetry data from modern systems in a vendor-neutral way. It began as two competing projects (OpenTracing from CNCF & OpenCensus from Google) aimed at providing a vendor-neutral distributed tracing API. The two merged in 2019 and have since added support for metrics and structured logs. OTel is now the second most active CNCF project after Kubernetes, and we’ve seen both emerging startups and incumbents align to the spec in the face of customer demand for standardization and cross-platform compatibility.
That said, while the community has generally embraced OTel, many enterprises are still early in the shift, particularly given the complexity of reinstrumenting legacy applications and converting existing runbooks tied to incumbent monitoring solutions. Nevertheless, we are excited to see OTel momentum continue in 2024 and, in particular, efforts by the CNCF to standardize query languages, improve OTLP (OpenTelemetry Protocol) data compression and introduce CI/CD telemetry support. We are also excited to watch the evolution of other open standards, including the Open Cybersecurity Schema Framework (OCSF), which attempts to set an industry-wide standard format for logging common security events.
– Bring-Your-Own Storage Backend
We believe an architectural shift is underway amongst many next-gen o11y tools, where data warehouses are becoming “the new backend,” and providers aim to fully decouple their storage and compute layers. This separation enables each infrastructure tier to be scaled independently and according to individual capacity requirements. By eliminating proprietary (and cost-prohibitive) indexers, this approach also unlocks optionality at the storage layer. In turn, this enables customers to ‘bring-their-own’ preferred database and storage solutions, sweat existing assets and achieve more granular control over data residency and access.
Providing this sort of interoperability is easier said than done, particularly when you consider the diverse performance characteristics, schema models and indexing styles of different storage engines. Observability platforms like Coralogix are a great example. They have architected their visualization tier and analytics engines to run across ‘cheap and deep’ storage solutions such as AWS S3.
– Visibility into the CI Pipeline
As software projects scale, both in terms of code base size and number of engineering resources, the complexity of their underlying CI/CD pipelines often increases. Slow build times, flaky tests and merge conflicts can delay releases, divert resources away from new feature development and increase infrastructure costs. These challenges are further amplified in the case of monorepos, where each commit has the potential to trigger build and test harnesses spanning an outsized portion of the total code base.
Engineering efficiency platforms such as Jellyfish are providing visibility into the end-to-end performance of the SDLC (e.g., cycle time, change lead time) in alignment with standard frameworks like DORA. When deviations from baseline occur, CI and test analytics solutions from companies like CircleCI (a Sapphire Ventures portfolio company) provide a next-level down of details to help pinpoint and remediate the source of a given bottleneck. They collect and alert on key metrics such as job durations and CI infrastructure utilization and can also detect flaky tests through historical analysis over multiple runs. Emerging startups like Trunk.io are collecting and then auto-commenting PRs with relevant performance data, while also providing live debug capabilities (e.g., pause jobs, SSH to ephemeral CI runners) to avoid costly restarts.
Though CI analytics and engineering intelligence tools are often considered outside the scope of ‘traditional’ monitoring or systems observability, we feel these tools are providing much-needed visibility to developers – and are indicative of a broader expansion of this category to cover all personas and phases of the product life cycle.
– Linking Business Outcomes to Systems Data
Product experience monitoring and system monitoring tools have traditionally operated in silos. More recently, we’ve seen a push to converge these domains to better understand the correlation between end-user behaviors and system-level signals. For example, product-level metrics might reveal sparse user engagement with a given feature. To enrich this metric, system monitoring tools might uncover that the feature’s underlying code suffers from high error rates or slow response times. Conversely, infrastructure monitoring tools might detect utilization spikes that, when correlated with product analytics, highlight problematic user behaviors, such as overusing a particular feature.
We see several players pushing the envelope here, augmenting Digital Experience Monitoring & Analytics with error tracking and other APM-focused metrics to provide a deeper understanding of specific user groups and their interactions with the system. Similarly, feature management platforms such as Statsig and Unleash are integrating with observability platforms to better correlate feature adoption with system-level performance signals.
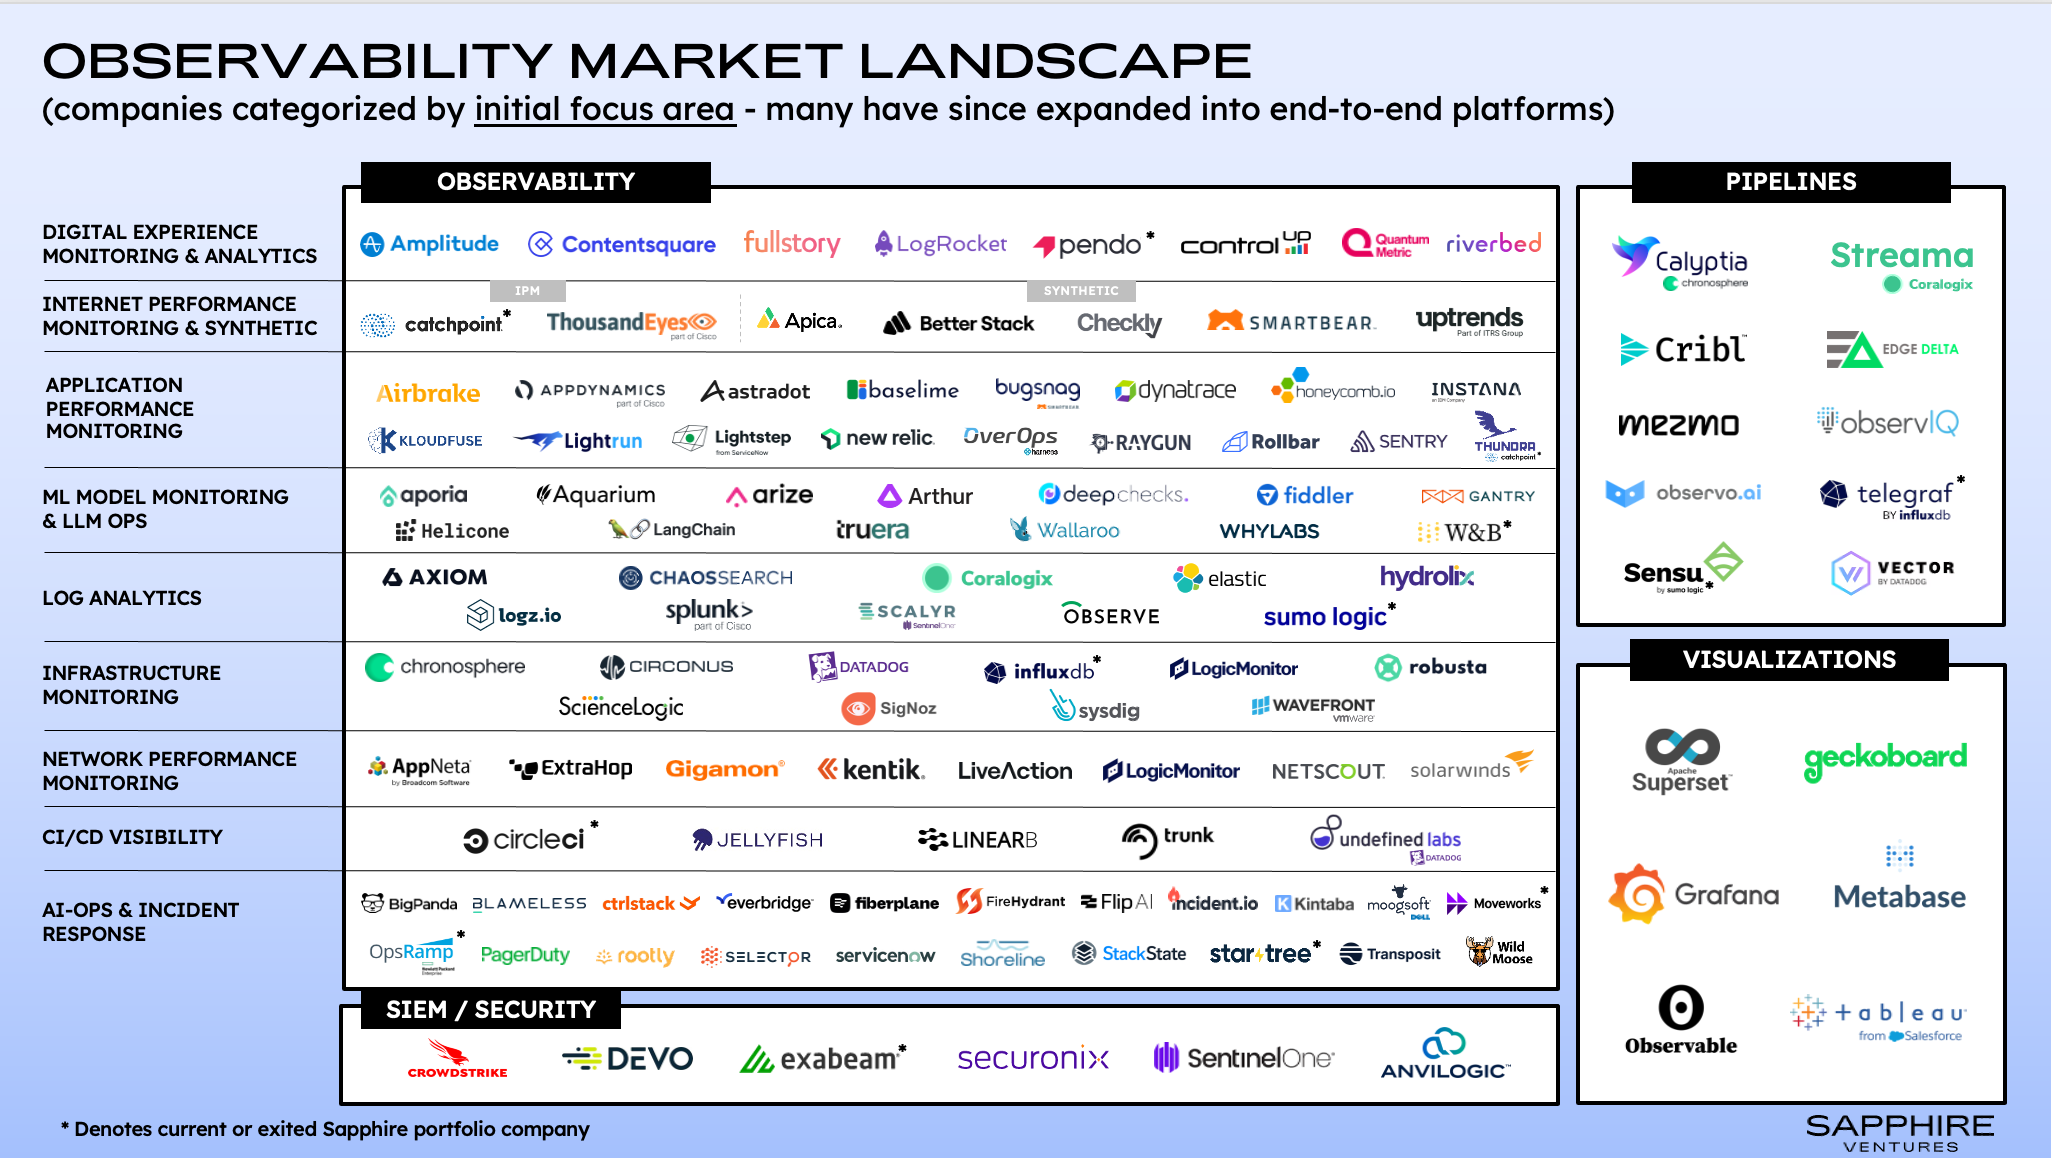
Navigating the O11y Market Landscape
In the map below, we’ve attempted to sort companies based on initial and/or historical market focus. However, many leading providers have and will continue to evolve into end-to-end platforms, enabling them to compete across a majority of the functional buckets we’ve outlined. Grafana, for example, is placed in the visualization bucket (where they are the de-facto standard), but has since expanded into a full-stack observability platform, offering APM, log analytics, infra monitoring, incident response and more.
Similar platform expansions are occurring not just on individual features but also cross-domain, specifically with the convergence of IT monitoring and cybersecurity. For example, Datadog focused initially on cloud infrastructure monitoring but has since expanded into the security realm with SIEM, CSPM and CWPP. Part of the reason for this convergence, in addition to finding new avenues for revenue growth, is that security and observability tools can often take advantage of overlapping data sets and deploy similar host agents for collection. By merging these capabilities, customers can avoid agent sprawl, achieve vendor consolidation objectives and derive unique insights from the combined data sets.
Charting the Future of Observability
With the evolution of application architectures, the ever-increasing growth in telemetry volumes and the availability of powerful new AI models, the o11y market is primed for disruption. We see significant opportunities for startups to disrupt the status quo and push the more established players to adapt and keep pace. They will look to create space with more performant and cost-effective hosting models, simplified user experiences, intelligent analytics and coverage across a wider breadth of personas and workload types. And while this blog highlighted some of the more impactful trends shaping this market, we’re eager to see how the landscape evolves and which new entrants and capabilities emerge in 2024 and beyond.
If you’re working on a game-changing new observability platform or have come up with a novel approach to this space, we’d love to hear from you! Feel free to drop us a line at [email protected], [email protected] and [email protected].
And a special thanks and shoutout to Amit Agarwal, Amol Kulkarni, Christine Yen, Martin Mao, Milin Desai, Nora Jones, Wailun Chan and Yanda Erlich for contributing their insights.