Originally published in TechCrunch here on December 30, 2016. This is the second part in a series of articles on venture capital investments in enterprise and consumer companies. You can read part one here and stay tuned for upcoming posts as we explore investment and exit trends related to this topic.
Value creation in enterprise tech is often driven by a cohort of exits, while value creation in consumer tech is generally driven by large, individual exits — a phenomenon I recently dug into. What the data revealed is that in recent years, there is a trend of larger consumer exits, such as Facebook, Twitter, and WhatsApp. And if this trend continues, that’s very good news for consumer-oriented funds.
But the data further begs a deeper dive on VC-backed exit dynamics, in particular, what are typical VC-backed exit sizes, including a look at the frequency of exits greater than $1 billion across enterprise and consumer.
For companies with IPO exits of $1 billion or more in valuation, venture-backed enterprise exits outpaced consumer exits until recently. There were 144 IPO exits with greater than $1 billion in value, of which 97 are enterprise companies and 47 are consumer companies.

On the M&A front, there were 96 exits of $1 billion or more in value, of which 65 are enterprise companies and 31 are consumer companies. Similar to the chart above, acquisition value of enterprise companies outpaced that of consumer companies until recently, when the venture capital ecosystem has become more accommodating of large M&A transactions, potentially driven by the run up in market capitalization of some of the earlier, successful IPOs of companies such as Google and Facebook.

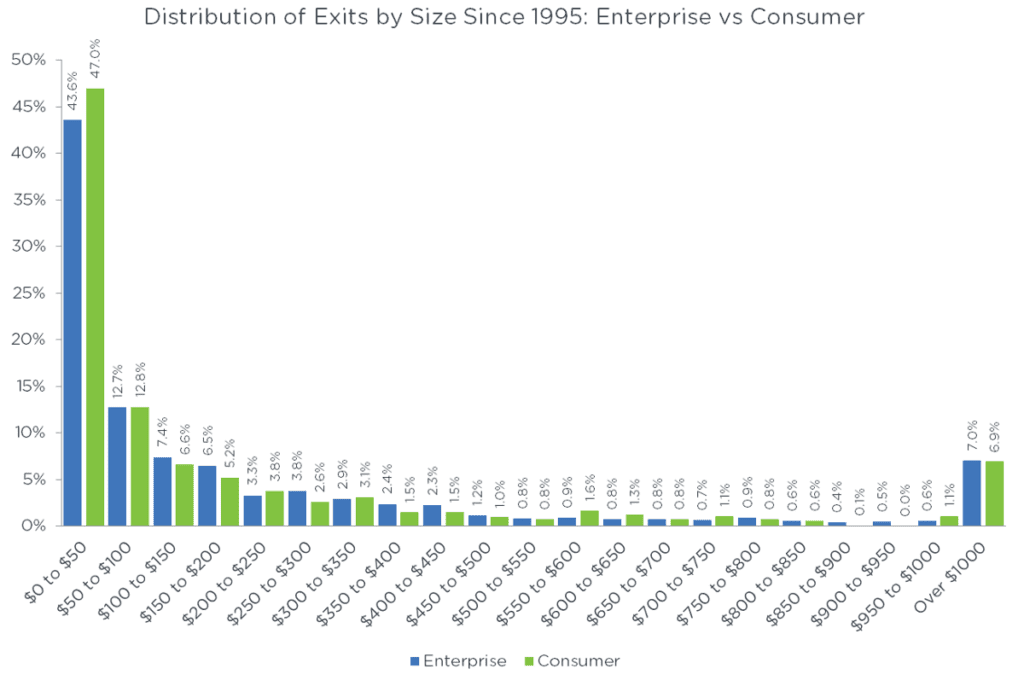
Of course, looking only at outcomes with $1 billion or more in value only covers a fraction of where most VC exits occur. Slightly less than half of all exits in both enterprise and consumer are $50 million or under in size, and more than 70 percent of all exits are under $200 million. Moreover, in the distribution chart below, we capture only the percentage of companies for which we have exit values. If we change the denominator to all exits captured in our database i.e. measure the percentage of $1 billion-plus exits by using a higher denominator, the percentage of outcomes drops to around 3 percent of all outcomes for both enterprise and consumer.

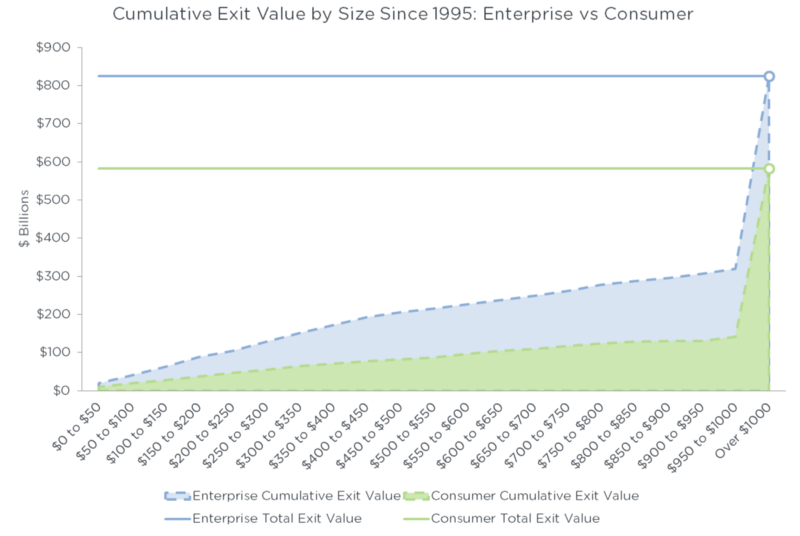
Additionally, it’s interesting to consider cumulative value accretion across exit sizes for both enterprise and consumer (see chart below). The power law of venture outcomes is apparent in both enterprise and consumer, whereby a significant portion of total exit value is generated by the $1 billion-plus outcomes. In particular, exits greater than billion dollars generate 62 percent of total returns for enterprise and 77 percent for consumer.

So, consistent with my previous conclusion about enterprise funds returning more capital than consumer ones, it furthermore turns out that the enterprise category has generated a larger cohort of successful outcomes, while outlier companies make up the vast majority of returns in the consumer category.
Okay, so now we have to wonder about capital invested in each category and how investment cost per annum correlates with exit value. My next article in this series will look into this question and more.


