This is the first part in a series of writings on enterprise and consumer investments in venture capital (VC). Stay tuned for upcoming posts as we explore investment and exit trends related to this topic. For those who have looked at similar market data, it would be interesting to compare notes.
Sometimes it makes sense to take a step back and ask big picture questions. For example, if you are a VC, could you provide better returns by investing in only enterprise or consumer companies, or a mix of both enterprise and consumer? How should investment and exit trends over the last five years influence your fund size and strategy?
In short, venture capital is about creating value and providing distributions for investors. Fail at this and you go out of business. Therefore we thought it would be important to explore how robust the investment and exit markets have been in recent history by pulling together data using Pitchbook and Capital IQ. Some of our initial findings are below.
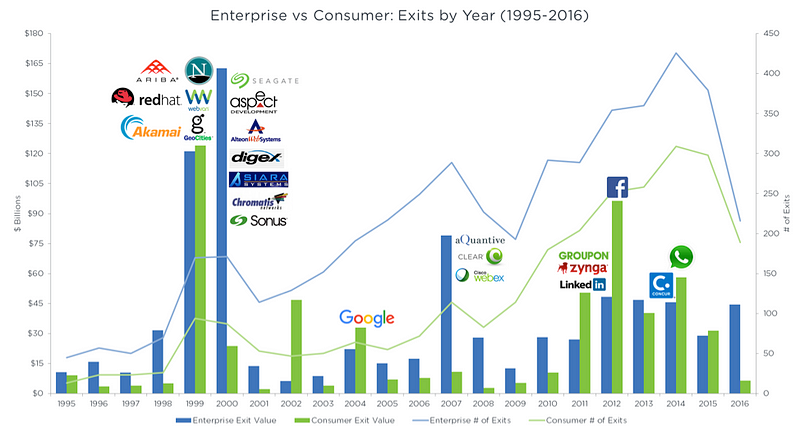
Since 1995, the number of enterprise exits has consistently outpaced consumer exits (blue line versus green line below). In the most recent five years, the value of consumer exits has eclipsed enterprise exits per year on a fairly consistent basis. Note that IPO exit values are based on the total market capitalization at time of IPO.
- Venture-backed enterprise tech companies have generated $825B in value since 1995; $410B from M&A and $414B from IPO.
- Venture-backed consumer tech companies have generated $582B in value since 1995; $168B from M&A and $414B from IPO.
- In total, there were over 4,600 venture-backed exits in enterprise tech and over 2,600 exits in consumer tech.
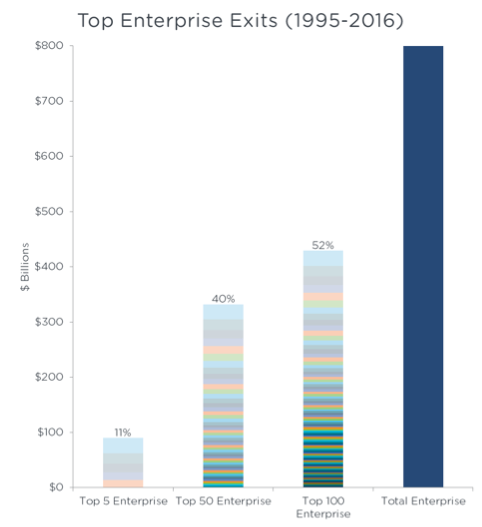
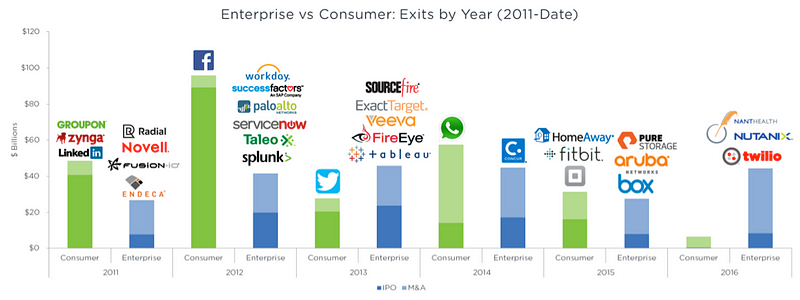
Since 1995, historical data shows that years of high value creation in enterprise tech is often driven by a cohort of exits, while value creation in consumer is often primarily driven by large, individual exits. This concentration of value creation in consumer is evident in the side-by-side comparison of enterprise versus consumer exits in the charts below. Does this trend indicate that it’s much more difficult to rely on consumer investments to drive fund returns if there are fewer outliers?
- The top five enterprise companies with largest exits account for $90B in value creation, or 11% of the $825B generated in the enterprise category since 1995.
- The top five consumer companies with the largest exits account for $211B in value creation, or 36% of the $582B generated in the consumer category since 1995.
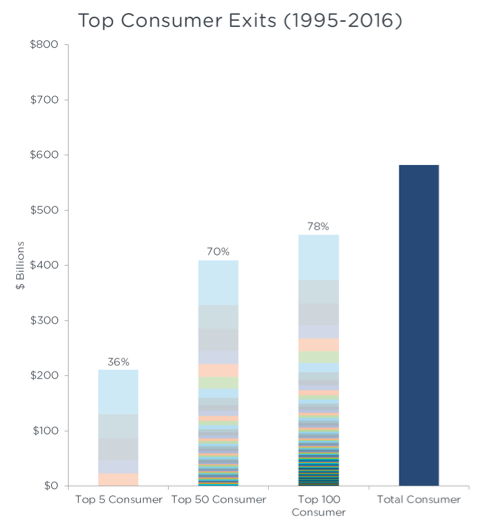
This trend of large, consumer outliers is clearly illustrated when zooming into the venture exit history of the past five years. Returns from large, consumer outcomes such as Facebook, Twitter and WhatsApp often account for more than the sum of a plethora of enterprise companies in any given year.
In our next post, we’ll dive deeper into venture capital exit dynamics, in particular, looking at the distribution of exit sizes since 1995, including the frequency of unicorn exits across enterprise and consumer.
Big thanks to Eugene Chou @ Sapphire Ventures who has helped with gathering the data for this project.