This article is a fresh take on a topic we originally explored in December 2016. Learn what changed when we went back and analyzed the returns data from the last couple of years.
A Dive into Enterprise vs Consumer Exit Activity
In today’s fast-paced market — where major funding or exit announcements seem to roll in daily — we at Sapphire Partners like to take a step back, ask big picture questions, and then find concrete data to answer them.
One of our favorite areas to explore is: as a venture investor, do your odds of making better returns improve if you only invest in either enterprise or consumer companies? Or do you need a mix of both to maximize your returns? And how should recent investment and exit trends influence your investing strategy, if at all?
To help answer questions like these, we’ve collected and analyzed exit data for years. What we’ve found is pretty intriguing: portfolio value creation in enterprise tech is often driven by a cohort of exits, while value creation in consumer tech is generally driven by large, individual exits.
In general, this trend has held for several years and has led to the general belief, that if you are a consumer investor, the clear goal is to not miss that “one deal” that has a huge spike in exit valuation creation (easier said than done of course). And if you’re an enterprise investor, you want to create a “basket of exits” in your portfolio.
What Creates More Portfolio Value: Consumer or Enterprise?
2019 has been a powerhouse year for consumer exit value, buoyed by Uber and Lyft’s IPOs (their recent declines in stock price notwithstanding). The first three quarters of 2019 alone surpassed every year since 1995 for consumer exit value – and we’re not done yet. If the consumer exit pace continues at this scale, we will be on track for the most value created at exit in 25 years, according to our analysis.
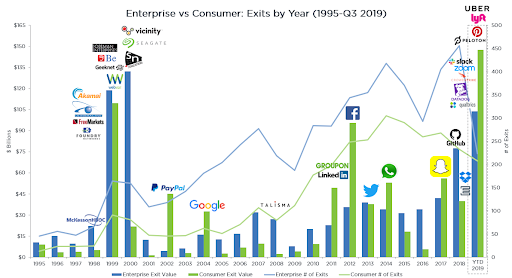
Since 1995, the number of enterprise exits has consistently outpaced consumer exits (blue line versus green line above), but 2019 is the closest to seeing those lines converge in over two decades (223 enterprise vs 208 consumer exits in the first three quarters of 2019). Notably, in five of the past nine years, the value generated by consumer exits has exceeded enterprise exits.[1]
At Sapphire, we observe the following:
- Venture-backed enterprise tech companies have generated $884B in value since 1995; $349B from M&A and $535B from IPOs.
- Venture-backed consumer tech companies have generated $773B in value since 1995; $153B from M&A and $620B from IPOs.
- In total, there were 5,600+ venture-backed exits in enterprise tech and 3,300+ exits in consumer tech.
While the valuation at IPO serves as a proxy for an exit for venture investors, most investors face the lockup period. 2019 has generated a tremendous amount of value through IPOs, roughly $223 billion. However, after trading in the public markets, the aggregate value of those IPOs have decreased by $81 billion as of November 1, 2019.[3] This decrease is driven by Uber and Lyft from an absolute value basis, accounting for roughly 66% of this markdown over the same period, according to our figures. Over half of the IPO exits in 2019 have been consumer, and despite these stock price changes, consumer exits are still outperforming enterprise exits YTD given the enormous alpha they generated initially.
As we noted in the introduction, since 1995, historical data shows that years of high value creation from enterprise technology is often driven by a cohort of exits versus consumer value creation that is often driven by large, individual exits. The chart below illustrates this, showing a side-by-side comparison of exits and value creation.
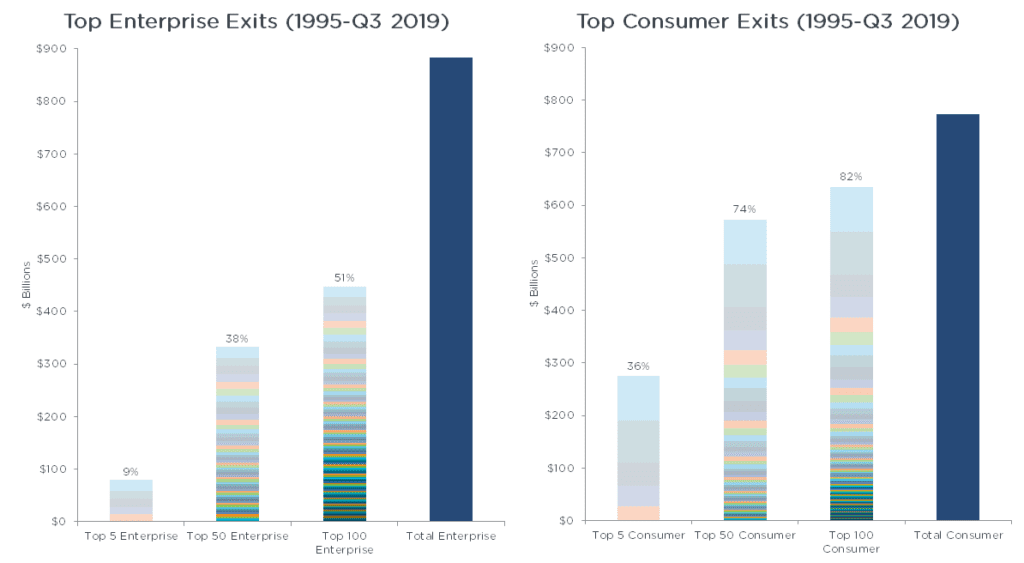
At Sapphire, we observe the following:
- The top five enterprise companies with the largest exits account for $79B in value creation, or 9% of the $884B generated in the enterprise category since 1995.
- The top five consumer companies with largest exits account for $276B in value creation, or 36% of the $773B generated in the consumer category since 1995.
The value generated by the top five consumer companies is 3.5x greater than that of enterprise companies.
Understanding the Consumer Comeback
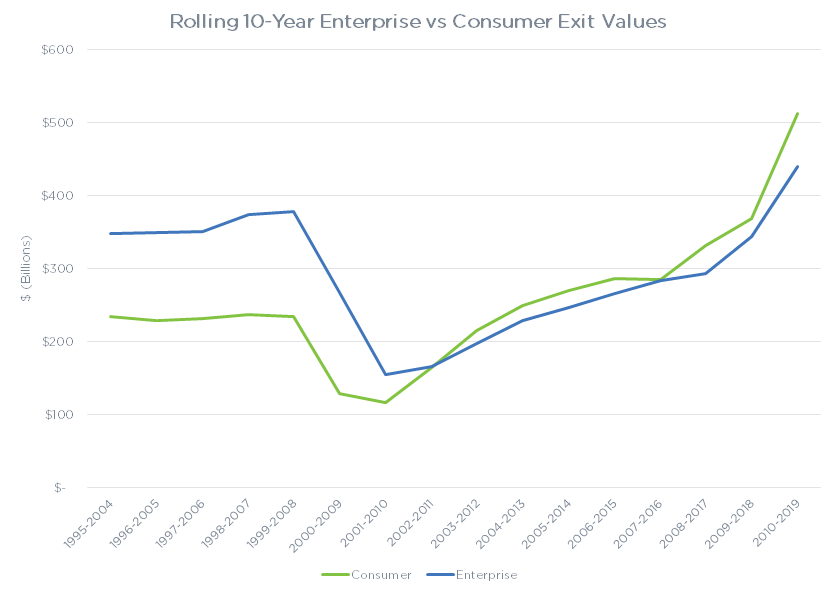
While total value of enterprise companies exited since 1995 ($884B) exceeds that of consumer exits ($773B), in the last 15 years, consumer returns have been making a comeback. Specifically, total consumer value exited ($538B) since 2004 exceeds that of enterprise exits ($536B). This difference has become more stark in the past 10 years with total consumer value exited ($512B) surpassing that of enterprise ($440B). As seen in the chart below, the rolling 10-year total enterprise exit value exceeded that of consumer, until the decade between 2003-2012 where consumer exit value took the lead.
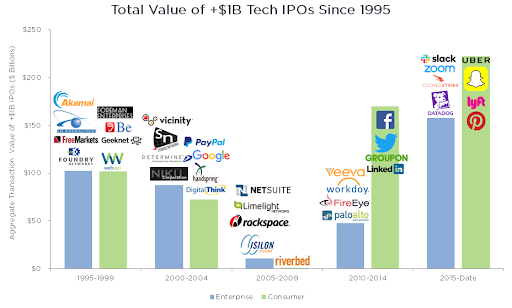
We believe size and then the inevitable hype around consumer IPOs has the potential to cloud investor judgment since the volume of successful deals is not increasing. The data clearly shows the surge in outsized returns comes from the outliers in consumer.
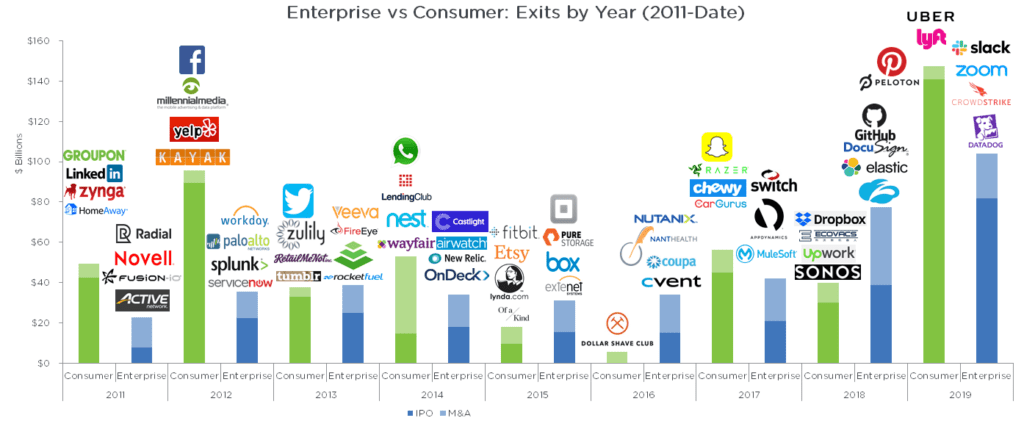
As exhibited below, large, consumer outliers since 2011 such as Facebook, Uber, and Snap often account for more than the sum of enterprise exits in any given year. For example, in the first three quarters of 2019, there have been 15 enterprise exits valued at over $1B for a total of $96B. In the same time, there have been nine consumer exits valued at over $1B for a total of $139B. Anecdotally, this can be seen from four out of the past five years being headlined by a consumer exit. While 2016 showcased an enterprise exit, it was a particularly quiet exit year.
- 2015 – Consumer: Fitbit ($6B)
- 2016 – Enterprise: Nutanix ($5B)
- 2017 – Consumer: Snap ($27B)
- 2018 – Consumer: Dropbox ($11B)
- First 3 quarters of 2019 – Consumer: Uber ($85B)
Enterprise Deals Still Rule in M&A
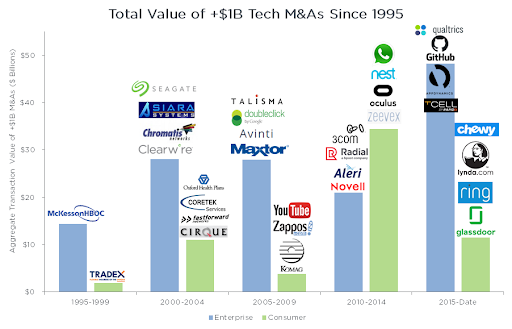
While consumer deals have taken the lead in IPO value in recent years, on the M&A front, enterprise still has the clear edge. Since 1995 there have been 76 exits of $1 billion or more in value, of which 49 are enterprise companies and 27 are consumer companies. The vast majority of value from M&A has come from enterprise companies since 1995 — more than 2x that of consumer.
Similar to the IPO chart above, acquisition value of enterprise companies outpaced that of consumer companies until recently, with 2010-2014 being the exception.
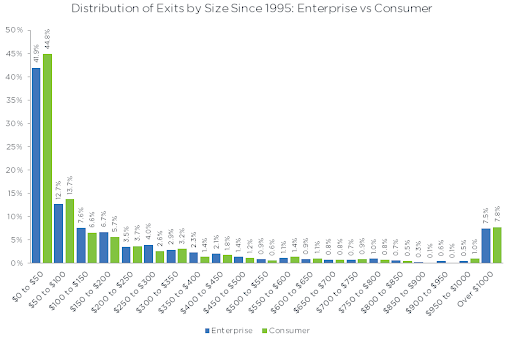
Of course, looking only at outcomes with $1 billion or more in value covers only a fraction of where most VC exits occur. Slightly less than half of all exits in both enterprise and consumer are $50 million or under in size, and more than 70 percent of all exits are under $200 million. Moreover, in the distribution chart below, we capture only the percentage of companies for which we have exit values. If we change the denominator to all exits captured in our database (i.e. measure the percentage of $1 billion-plus exits by using a higher denominator), the percentage of outcomes drops to around 3 percent of all outcomes for both enterprise and consumer.
What Does All of this Mean for Venture Investors?
There’s an enormous volume of information available on startup exits, and at Sapphire Partners, we ground our analyses and theses in the numbers. At the same time, once we’ve dug into the details, it’s equally important to zoom out and think about what our findings mean for our GPs and fellow LPs. Here are some clear takeaways from our perspective:
- Consumer exits have surpassed enterprise over the past 15 years.
- Consumer exits value is highly concentrated in the top deals.
- There are more billion-dollar enterprise IPOs than billion-dollar consumer exits, so you may have more opportunities for a unicorn enterprise outcome than you do a consumer.
- However, if you happen to invest in one of the outlier consumer exits, you could experience significant returns.
In a nutshell, as LPs we like to see both consumer and enterprise deals in our underlying portfolio as they each provide different exposures and return profiles. However, when these investments get rolled up as part of a venture fund’s portfolio, success is often then contingent on the fund’s overall portfolio construction… but that’s a question to explore in another post.
NOTE: Total Enterprise Value (“TEV”) presented throughout analysis considers information from CapIQ when available, and supplements information from Pitchbook last round valuation estimates when CapIQ TEV is not available. TEV (Market Capitalization + Total Debt + Total Preferred Equity + Minority Interest – Cash & Short Term Investments) is as of the close price for the initial date of trading. Classification of “Enterprise” and “Consumer” companies presented herein is internally assigned by Sapphire. Company logos shown in various charts presented herein reflect the top (4) companies of any particular time period that had a TEV of $1BN or greater at the time of IPO, with the exception of chart titled “Exits by Year, 1995- Q3 2019”, where logos shown in all charts presented herein reflect the top (4) companies of any particular year that had a TEV of $7.5BN or greater at the time of IPO. During a time period in which less than (4) companies had such exits, the absolute number of logos is shown that meet described parameters. Since 1995 refers to the time period of 1/1/1995 – 9/30/2019 throughout this article.
[1] Includes the first three quarters of 2019. IPO exit values refer to the total enterprise value of a company at the end of the first day of trading according to S&P Capital IQ. Analysis considers a combination of Pitchbook and S&P Capital IQ to analyze US venture-backed companies that exited through acquisition or IPO between 1/1/1995 – 9/30/2019.[2] Lockup period is a predetermined amount of time following an initial public offering (“IPO”) where large shareholders, such as company executives and investors representing considerable ownership, are restricted from selling their shares. [3] Total enterprise value at the end of 10/15/2019 according to S&P Capital IQ.


