We are frequently asked what drives outperformance for a venture fund. We strongly believe venture is a game of power laws – meaning only a small percentage of returns is responsible for a large percentage of overall return value, either for a specific fund or the industry as a whole. It should come as no surprise then that to have an outperforming fund, one must have invested in a power law returning company or companies. With this in mind, are there patterns to be recognized within these power law exits?
Or relatedly, as a venture investor, do your odds of making better returns improve if you only invest in either enterprise or consumer companies? Or do you need a healthy mix of both to maximize your returns? And how should recent investment and exit trends influence your investing strategy, if at all?
To help answer these questions, we’ve collected and analyzed decades of venture performance data, and every few years, we reevaluate to spot new trends. (See here for our 2019 analysis and here for our 2016 analysis.) What we’ve found is pretty intriguing in its consistency as described throughout this article.
Key summary of our observations, given the analysis below:
- Portfolio value creation in enterprise tech is often driven by a cohort of exits, while value creation in consumer tech is generally driven by large, individual exits.
- Looking back to 1995, aggregate enterprise exit value has been greater than aggregate consumer exit value. However, more recent years of the past decade tell a different story – with consumer taking the lead.
- Consumer exit outperformance is highly concentrated and dependent on the top deals.
- There are more billion-dollar enterprise exits than billion-dollar consumer exits, so there may be more opportunities for a unicorn outcome in the enterprise space than consumer.
- Billion-dollar enterprise exits can occur in both up and down markets as enterprise companies’ consistency of outperformance comes from both IPOs and large M&A to PE and corporations (hat tip Figma).
- In contrast, it’s our observation that for consumer companies to outperform, they must not only exit through IPO, but also in a favorable IPO market.
- Said differently, the power of power law is very real when it comes to deriving the most value in consumer exits – both in which companies exit, as well as how and when.
- If consumer outperformance comes from the IPO power law, the enterprises exit power law is one of persistence and resilience.
What Creates More Portfolio Value: Consumer or Enterprise?
2022 has been a bumpy year to say the least, and nowhere is that more clear than the exit environment, with aggregate exit values dropping over 95% from 2021’s exceptionally busy IPO market. That said, we’ve seen downturns before, and therefore anticipate it’s likely that the balance of exits shifts to M&A for the rest of 2022 and possibly Q1’23.
We’ve seen buyout activity from private equity firms with announcements of deals from firms like Thoma Bravo around Ping Identity, Anaplan, and SailPoint this year, as these firms take advantage of market dislocation. As these deals and others close, we expect to see 2022’s exit landscape continue to be highly biased towards enterprise M&A, as kicked off by Microsoft’s $20Bn acquisition of Nuance Communications in March, followed by the recently announced potential $20BN Figma acquisition by Adobe. Consumer could remain comparatively muted if equity markets don’t pick back up, especially given public investors’ heightened focus on profitability over the growth-at-all-costs mentality of the last cycle.
Power Law Exit Environment
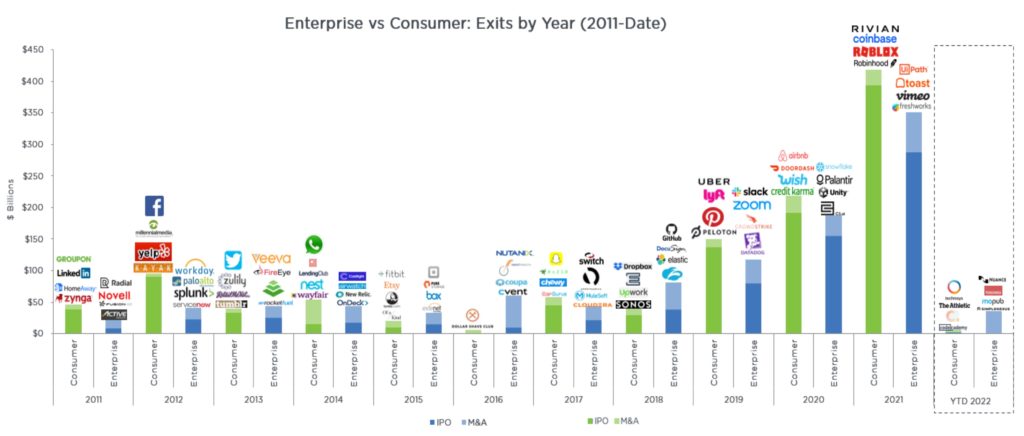
2019, 2020, and 2021 were banner years for both consumer and enterprise exit value, with mega-consumer IPOs like Rivian, Coinbase, Roblox, Robinhood, Airbnb, Doordash, Uber, Lyft, and Pinterest, and enterprise exits led by UiPath, Toast, Snowflake, Palantir, Unity, Slack, Zoom, Crowdstrike, and Datadog. 2021 surpassed every year since 1995 for consumer and enterprise exit value. Or said another way – 2021 was a power law generating exit year – with consumer leading the way, generating ~$418BN in exit value vs enterprise’s ~$351BN.
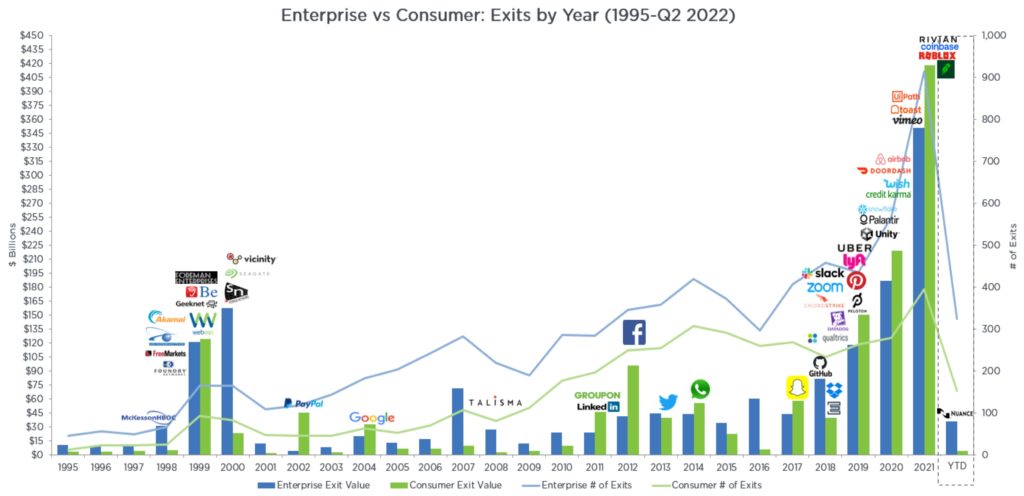
Since 1995, the number of enterprise exits (blue line in fig. 1) has consistently outpaced consumer exits (green line in fig. 2), and we saw that trend reach its peak in 2021, with 915 enterprise exits relative to 395 consumer exits. Interestingly though, over the past decade, consumer exit value exceeded enterprise exit value in five years, while enterprise exit value exceeded consumer exit value in five years.[1]
At Sapphire, our analysis of the graph above (fig. 1) observes the following:
- Venture-backed enterprise tech companies have generated $1,609B in value since 1995 ($622B from M&A and $987B from IPOs).
- Venture-backed consumer tech companies have generated $1,436B in value since 1995 ($240B from M&A and $1,196B from IPO)s.
- In total, there were 7,600+ venture-backed exits in enterprise tech and almost 4,200 exits in consumer tech.
While the valuation at IPO often serves as a valuable exit proxy for venture investors, many investors often then face the lockup period, which prohibits the actual exit for a stated period of time.[2] 2019-2022 have generated a tremendous amount of value for enterprise and consumer companies that have conducted or gone through IPOs – to the tune of $1 trillion+. However, after trading in the public markets, the aggregate value of these IPOs have decreased by ~52% as of September 30, 2022, according to PitchBook data.[3] Of note, public consumer companies that IPO’d during this period have been more severely impacted compared to their enterprise counterparts, with consumer companies losing 61% of aggregate EV compared to only 37% for enterprise companies.[4]
As we mentioned in the introduction, since 1995, historical data shows that years of high value creation from enterprise technology is often driven by a cohort of exits versus consumer value creation that is often driven by large, individual exits. Figure 2 below illustrates this, showing a side-by-side comparison of exits and value creation.
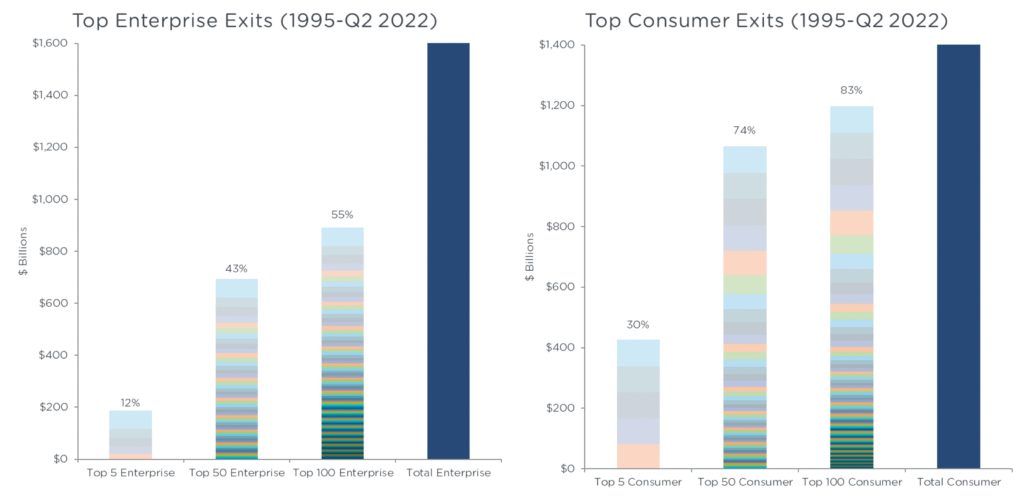
At Sapphire, our analysis of the graph above (fig. 2) observes the following:
- The top five enterprise companies with the largest exits account for $188B in value creation, or 12% of the $1,609B generated in the enterprise category since 1995.
- The top five consumer companies with largest exits account for $426B in value creation, or 30% of the $1,436B generated in the consumer category since 1995.
The value generated by the top five consumer companies is 2.3x greater than that of enterprise companies.
Is Consumer Back? Or is Enterprise Hanging Tough?
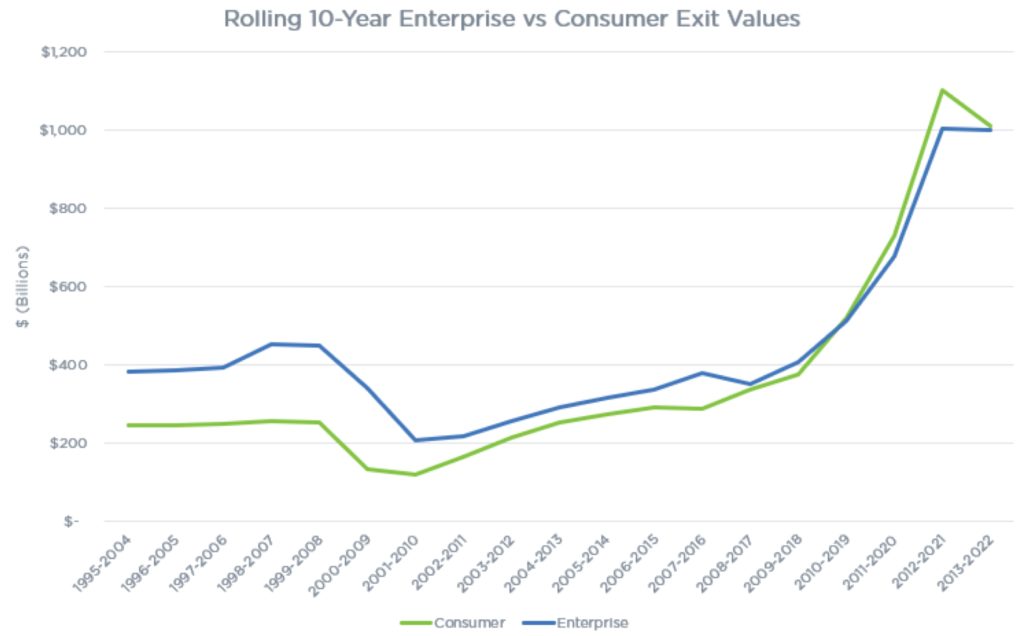
While total value of enterprise companies exited since 1995 ($1,609B) exceeds that of consumer exits ($1,436B), if we look more recently, the difference in total exit value between enterprise and consumer companies is narrow. For example, from 1995-2010, consumer only outperformed enterprise in total exit value across three of those years: 1999, 2002, and 2004. Total enterprise exit value was $547B versus the total consumer exit value of $283B. However, beginning in approximately 2011, consumer returns have made a comeback, with a notable major resurgence from 2019-2021. Specifically, total consumer value exited since 2011 ($1,153B) exceeds that of enterprise exits ($1,063B), with consumer beating enterprise in seven years since 2011.
Further, as seen in figure 3 below, the rolling 10-year total enterprise exit value and the consumer exit value had been running a close race for supremacy for almost a decade. Consumer’s superpower is its major power law exits. Specifically, consumer has really relied on enormous IPOs during this long bull-run and booming IPO market. These huge exits notwithstanding, enterprise has pulled nearly even with consumer in the last few years.
Given the tough exit market in 2022 and the likelihood of more enterprise M&A exits (to PE firms or otherwise), it’s hard for us to see consumer making a comeback this year. If we look at previous “down IPO” years for comparison, there are interesting data points as well.
During the 2008-2009 downturn, consumer exits totaled only $6.3B, with OpenTable marking the single consumer IPO during this period, compared to the eight enterprise IPOs and a total of $38.6B.
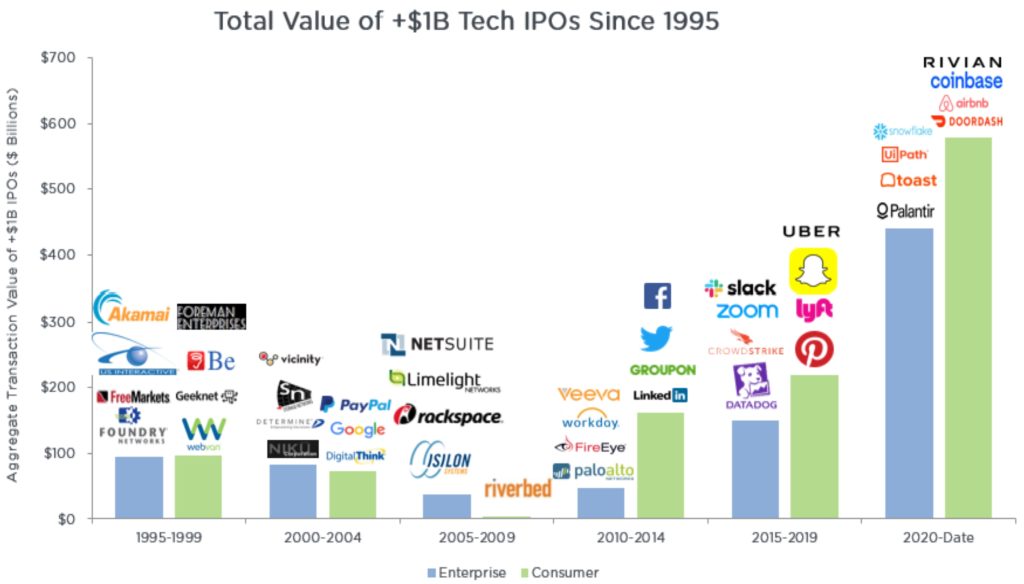
As exhibited in figure 4 above and figure 5 below, some large consumer outliers since 2011, such as Rivian, Facebook, Uber, and Snap, exited several times higher than the biggest enterprise exits. In fact, the top 1% of consumer exits since 1995 have been 140% larger than the top 1% of enterprise exits.
Anecdotally, every year since 2011 can be seen as headlined by a consumer exit. While 2016 and 2022 both showcased enterprise exits, they were also both particularly quiet exit years. Notably as well, all of the largest deals in every year since 2011 have been IPOs, with the large acquisition of WhatsApp by Facebook in 2014 as one exception, and the blatant exception of 2022’s so far effectively closed IPO market.
- 2011 – Consumer: Groupon ($16B)
- 2012 – Consumer: Facebook ($81B)
- 2013 – Consumer: Twitter ($24B)
- 2014 – Consumer: WhatsApp ($22B)
- 2015 – Consumer: Fitbit ($6B)
- 2016 – Enterprise: Nutanix ($5B)
- 2017 – Consumer: Snap ($27B)
- 2018 – Consumer: Dropbox ($11B)
- 2019 – Consumer: Uber ($85B)
- 2020 – Consumer: Airbnb ($86B)
- 2021 – Consumer: Rivian ($88B)
- 2022 – Enterprise: Tie between Nuance ($20B) and recently announced Figma ($20B)
Note: Figures above either represent (i) total enterprise value at the end of the first day of trading for companies that IPO’d or (ii) the acquisition amount for companies that were acquired.
Enterprise Deals Still Rule in M&A
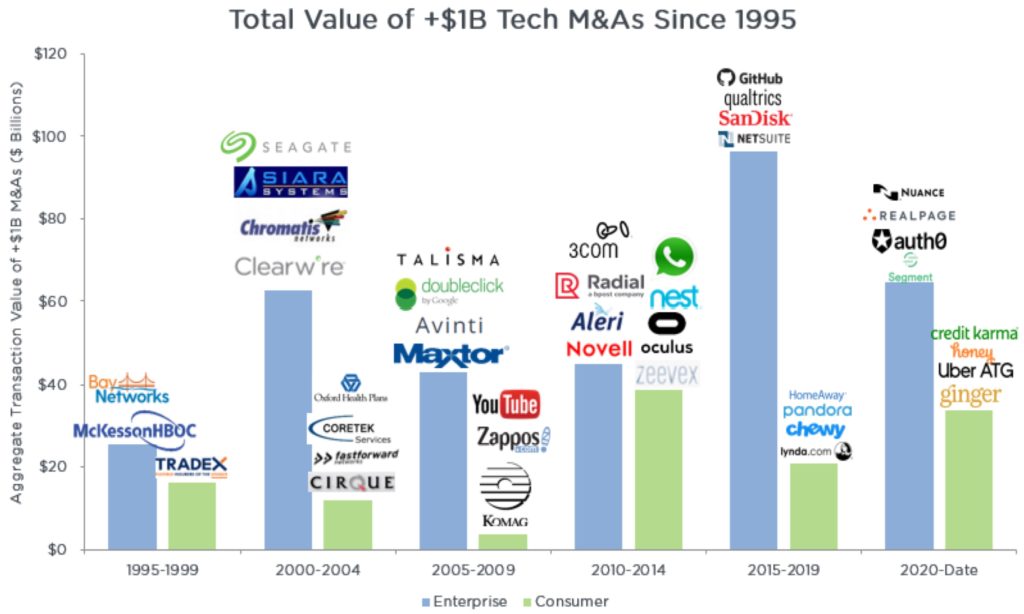
While consumer deals have maintained the lead in IPO value in recent years, enterprise has retained a clear edge on the M&A front. Since 1995, there have been 158 exits of $1 billion or more in value: 108 coming from enterprise and only 50 from consumer. The vast majority of value from M&A has come from enterprise companies since 1995 ($622B) – more than 2.5x that of consumer ($240B).
Similar to the IPO chart in figure 4, acquisition value of enterprise companies far outpaced that of consumer companies until recently, with 2010-2014 being the exception.
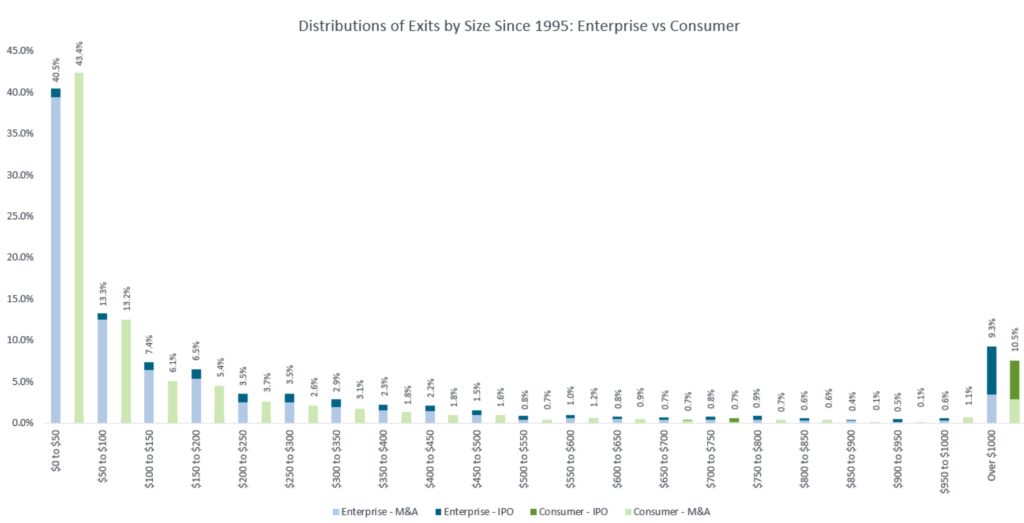
Of course, looking exclusively at outcomes with $1 billion or more in value covers only a fraction of where most VC exits occur. Less than half of all exits in both enterprise and consumer are $50 million or under in size, and slightly less than 70% of all exits are under $200 million. Moreover, in the distribution chart below (fig. 7), we capture only the percentage of companies for which we have exit values. If we change the denominator to all exits captured in our database (i.e. measure the percentage of $1 billion-plus exits by using a higher denominator), the percentage of outcomes drops to around 3.5% of all outcomes for both enterprise and consumer.
What Does All of this Mean for Venture Investors?
We believe to have a truly outperforming fund, there must be power law exits in it. And in looking at the data of power law exits over the last few decades, we believe the following is true:
- If you are a consumer investor, the clear goal is not to miss that “one deal” that has a huge spike in exit valuation creation. Of course, that is easier said than done.
- Further, as a consumer investor interested in making money (DPI, not just TVPI), two other things must also be true along with picking the right investment: Having your consumer company go out into a strong IPO market, and then selling shares before the stock drops.
- On the other side of the house, if you’re an enterprise investor, you want to create a “basket of exits” in your portfolio. And while it is never easy to exit a company, the persistence of M&A options for enterprise companies in up and down markets helps to continue to support enterprise power law exits.
- Are you therefore guaranteed to have an outperforming fund if you invest in a basket of enterprise companies? It would be great if it was that simple. Another critical factor in creating an outperforming fund is the interplay between the fund size, the check size into a power law-exiting company, the initial entry valuation and ownership.
- One can however look to the power law exit patterns to at least understand the historical patterns and potential odds for success in enterprise versus consumer investing, and use that to one’s investing advantage.


