
Just a month ago I wrote about why we are Embracing the Cloud here at Sapphire Ventures. The basic thesis is that cloud adoption has inflected and as a result, SaaS stocks are likely to outperform the market for years to come due to the growth tailwinds. So far this thesis is playing out in 2019, with SaaS stocks up almost 30% year-to-date, just two and a half months into the year(i).
But I received some feedback on the blog along the lines of: “Yeah, SaaS stocks may be up, but what about new company creation? And what about exit alternatives for software entrepreneurs, given that the tech IPO market appears to be stuck in the mud, with fewer than 10 software IPOs on average annually over the past 10 years?(ii)” Put another way, “can’t we just go back to the good old days with a lower IPO bar and more truly emerging-growth IPOs?”
Here at Sapphire Ventures we don’t see it that way; we like the capital markets set up for software entrepreneurs in the “here and now” of 2019. We believe the glass is way more than half full. Let’s go through the good news – and there’s plenty of it. Here’s a graph of tech and software IPOs over the past decade since the financial crisis of 2008:
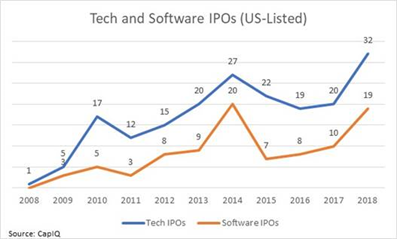
IPO activity is on the rise, with more than 30 tech IPOs in 2018. More importantly from a software perspective, 2018 saw nearly five new software IPOs each quarter. With software IPOs now comprising ~60% of all tech IPOs, we see that as a bullish sign for software investment. In the decade prior, software IPOs averaged just 46% of all tech IPOs(ii).
Yes, the IPO bar is higher, with the average LTM revenues for the 32 tech IPOs in the class of 2018 coming in at $284M and median LTM revenues at $192M. This squares with what I’m hearing bankers routinely say for software companies these days that the minimum IPO bar is $100M in the rear-view mirror and approaching $200M in the calendar year of the IPO(ii).
But funding for late-stage tech innovation is on the rise. The IPO is just one step on a company’s capital markets journey. Take a look at the following chart:
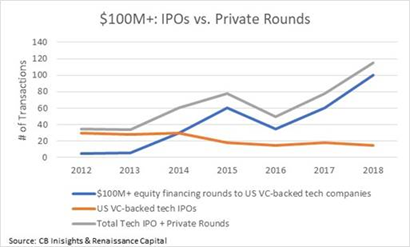
VC-backed tech IPO activity may have stagnated, but this belies the underlying story that mega-round funding for technology companies is on a steady rise. In today’s world, we define mega-rounds as IPOs combined with $100M+ late-stage private equity rounds (the up-and-to-the-right gray line in the chart above). Back in the so-called good old days, typical tech IPO deal size was $100M or less. At current levels, this would equate to 10 such financings every month between the public and private markets. I believe today’s private markets are far more entrepreneur-friendly in accepting founder liquidity as part and parcel of the round than yesterday’s IPO markets ever were(iii).
I feel another strong indicator of health in today’s markets is the amount of capital raised prior to IPO. The typical tech company raises more than $200M prior to going public today (in fact, $239M at the median in the IPO class of 2018), versus just $64M at the median in 2012. To me, this means that funding for tech innovation is plentiful – and better yet, when companies do go public, they are on steadier footing with a stronger balance sheet, higher revenue levels and more mature systems to ensure they can weather the storm of quarterly earnings reports(ii).
Back in the so-called good old days, we used to talk about the “valley of death” where newly public tech companies went to die as they tried to march through $500M market cap and come out the other side at $2B. This death valley existed because software companies that hadn’t proven they could scale went public too soon at $500M market caps. Many of these companies had false “exits” – the company didn’t scale, missed growth estimates, and entrepreneurs and VCs alike didn’t achieve the liquidity they were looking for. In the 2010 class of tech IPOs, the median market cap at IPO was $535M, and the median market cap for these same 17 companies two years later (on the last trading day of January 2013) was just $390M. (And by the way, the markets weren’t too shabby overall in 2011 and 2012.) Contrast that to the tech IPO class of 2016. 19 tech companies went public in 2016 at a median market cap of $718M and traded up to $1.2B two years later (at the end of January 2019). The average statistics are even more compelling: IPO market cap of $1.0B, trading to $2.4B on average as of January 2019. The higher IPO bar has all but eliminated the valley of death(ii).
And here’s some more good news for software entrepreneurs. The number of $2B+ market cap software companies (just the public ones, not even counting private unicorns) is up from just 15 in 2000 to 76 today. Plus, as the chart below shows, software companies are becoming that much more important to the tech ecosystem, making up ~20% of all tech companies with $2B+ market caps back in 2000 (and even as recently as 2010), but close to 40% of all $2B+ tech companies today(ii).
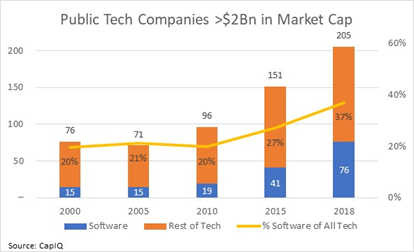
With 76 $2B+ public software companies and more than 200 total $2B+ tech companies, there are plenty of companies with the scale and the firepower to acquire today’s VC-backed software companies. Not only that but let’s take a quick look at the trading multiples. Back in 2010, the 19 $2B+ public software companies traded at median multiples on next year’s statistics of 5.5x revenues, 17.5x EBITDA and 28.7x price/earnings ratio. Today, the 76 $2B+ public software companies trade roughly 30-40% higher at 7.0x NTM revenues, 25.4x EBITDA and 39.3x P/E(ii).
With so many potential acquirors trading at attractive multiples, it’s not surprising that the number of $500M+ software M&A exits annually has nearly doubled from 21 back in 2010 to 38 in 2018. And remember, the average IPO back in the so-called “good old days” used to clock in at around $500M as well – yet there were only 5 of those annually in the 2010 timeframe(ii).
With IPOs no longer stuck in the mud, with mega-round fundings skyrocketing and with the number of solid M&A outcomes nearly doubling year-over-year, I think it is safe to say that these are the good old days for software entrepreneurs.
Thanks to Sapphire Ventures Associate Jane Lee for pulling all this great data for me.